Correction: An earlier version of this article stated that boys' graduation rate was lower than the rate for economically disadvantaged students. At 67.2%, the 2017 male graduation rate was slightly higher than the 66.4% economically-disadvantaged rate. The article has been updated.
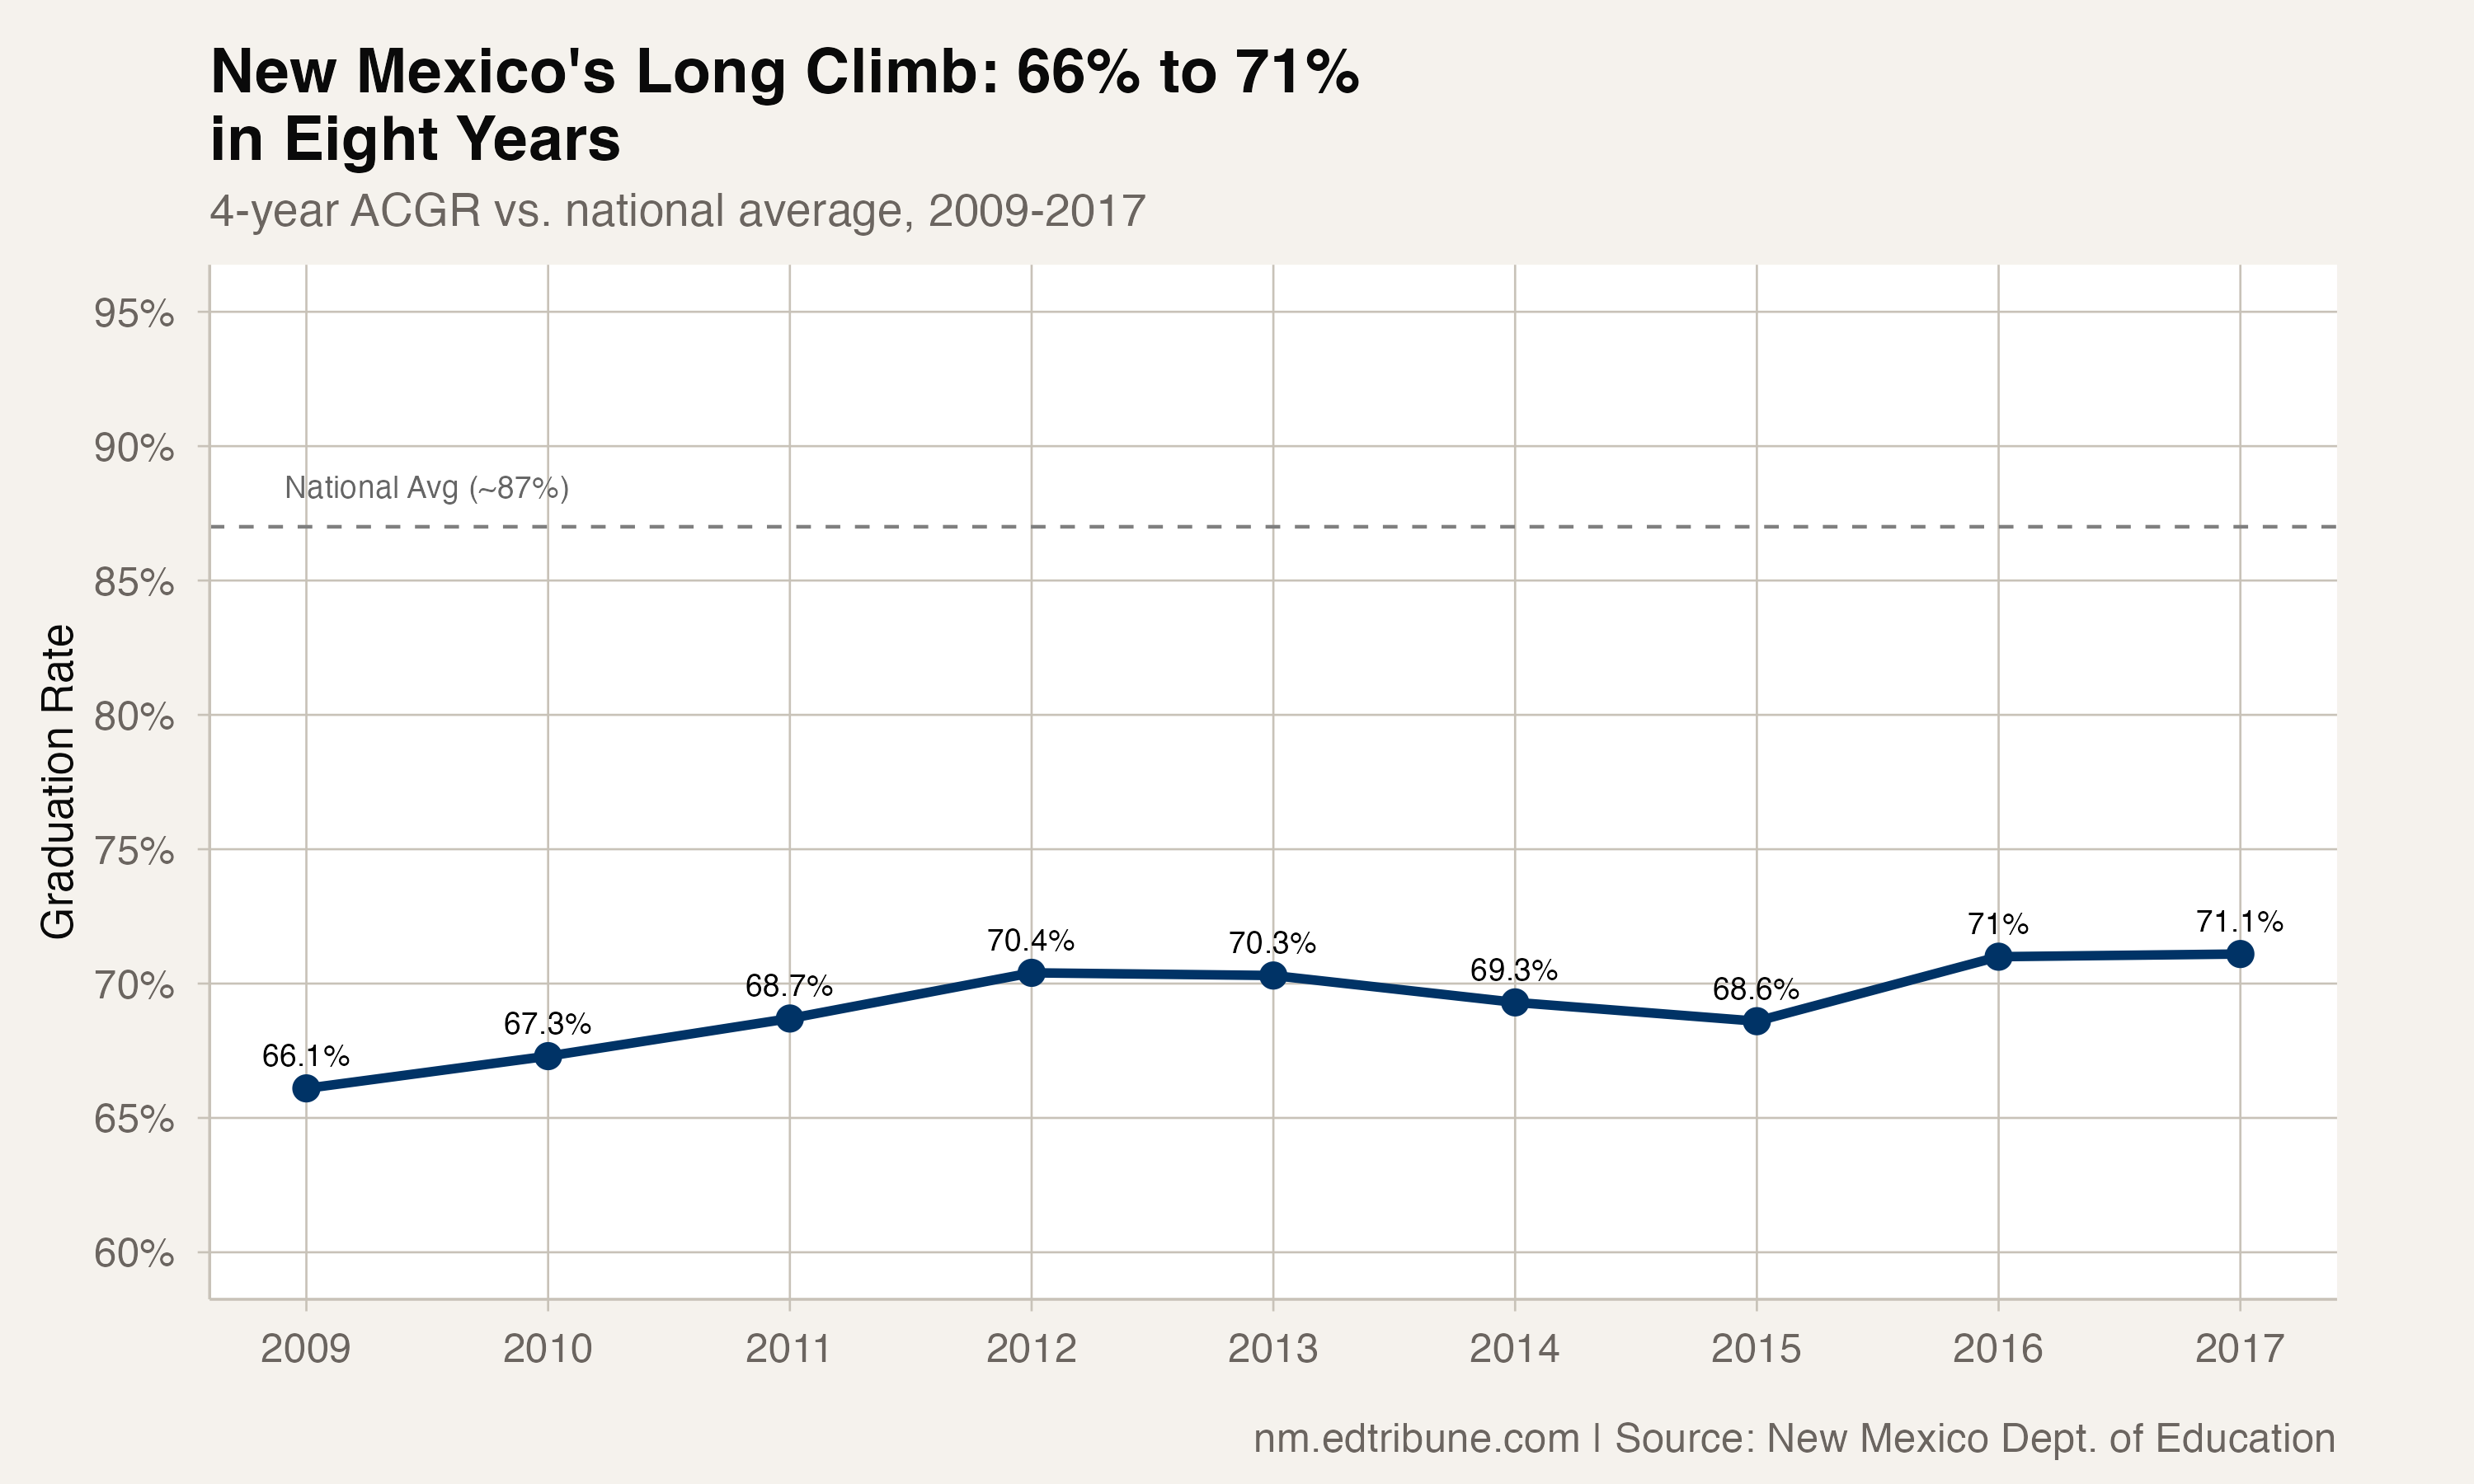
New Mexico's four-year graduation rate reached 71.1% for the Class of 2017. The national average was roughly 87%.
That 15.9 percentage-point gap means New Mexico graduates its students at a rate nearly one-sixth lower than the country as a whole. The gap has narrowed somewhat since 2009, when the state first adopted the Adjusted Cohort Graduation Rate and measured 66.1%. But five points of improvement over eight years still leaves the state closer to where it started than to where it needs to be.
The three phases
The state's journey from 66% to 71% was not a steady climb. It came in three distinct phases.
From 2009 to 2012, the rate improved by 4.3 points. Each year brought a gain: 1.2 points, then 1.4, then 1.7. By 2012, New Mexico had crossed 70% for the first time since adopting the ACGR methodology, reaching 70.4%.
Then the progress reversed. From 2013 to 2015, the rate slid back 1.8 points to 68.6%. The losses were modest individually -- a tenth of a point here, a full point there -- but they erased nearly half the gains of the previous three years.
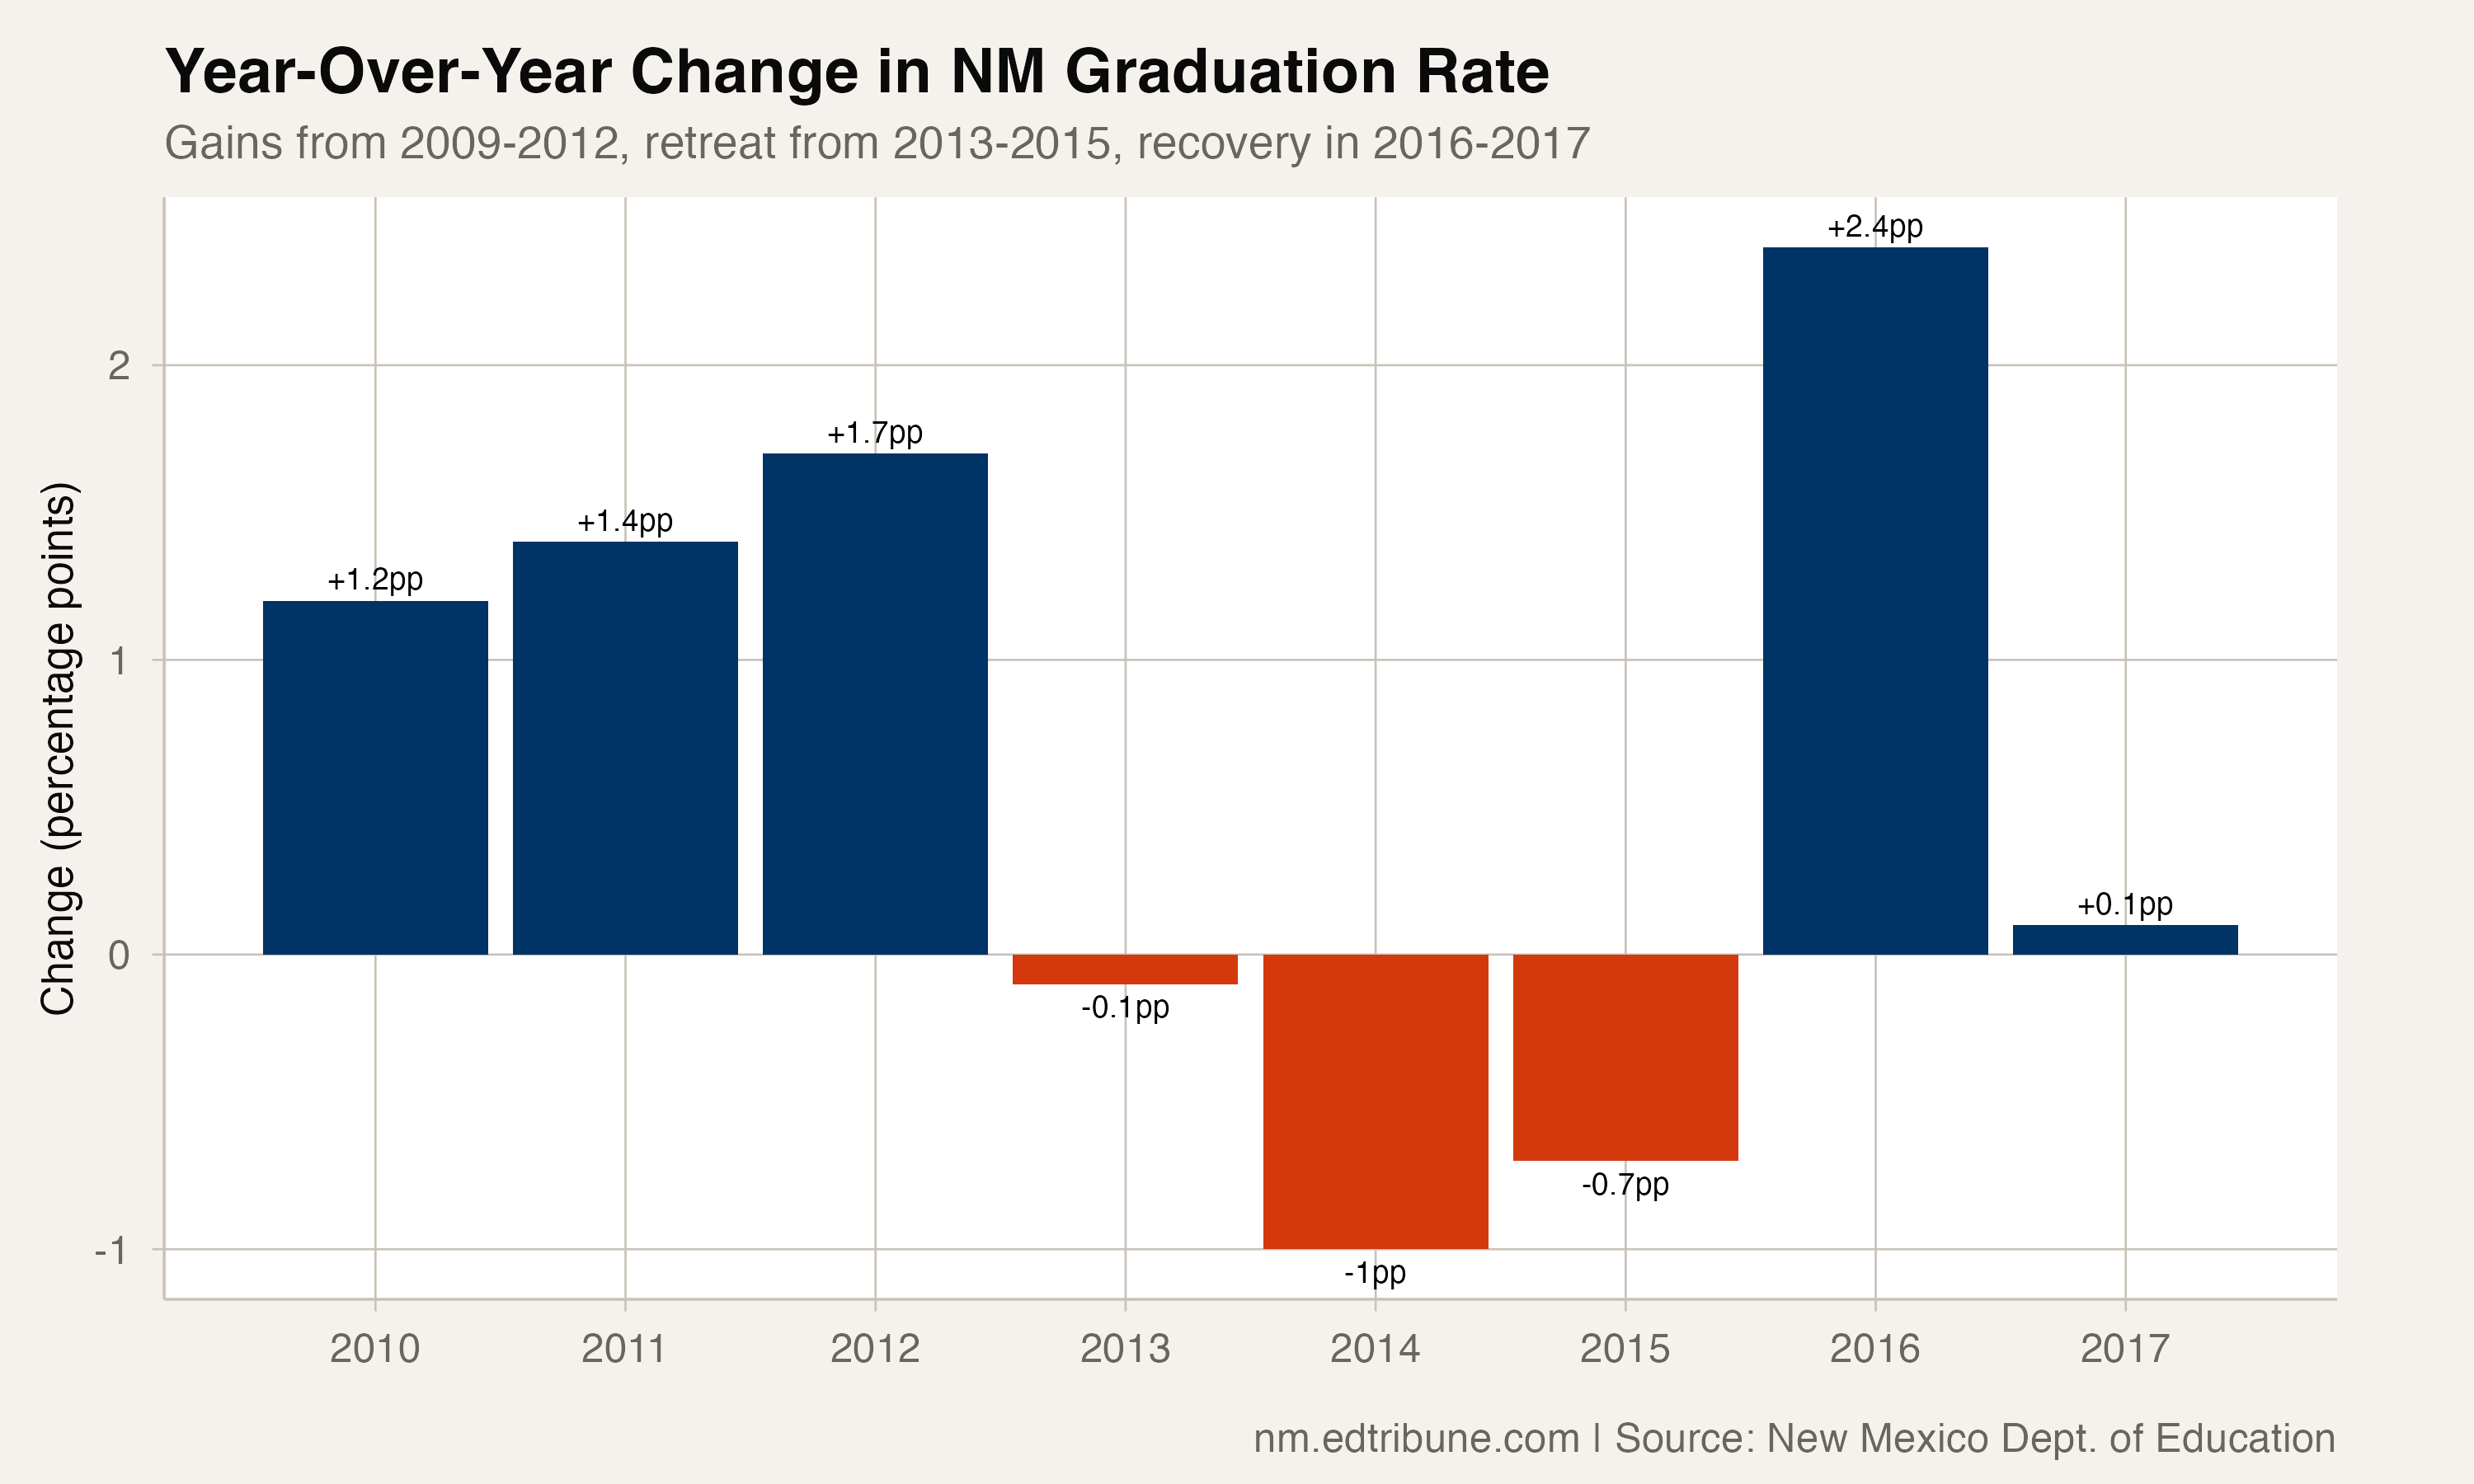
The third phase brought recovery. In 2016, the rate jumped 2.4 points to 71.0%, the largest single-year gain of the ACGR era. In 2017, it edged up to 71.1%. The state had recovered its ground and set a new high -- but barely exceeded where it had been five years earlier.
Who improved, who did not
The statewide number obscures very different trajectories for different groups of students.
Hispanic students, who make up the largest share of New Mexico's student population, improved the most: 7.5 percentage points, from 63.0% to 70.5%. Black students and economically disadvantaged students each gained 6.5 points. Asian students moved from 80.0% to 85.4%.
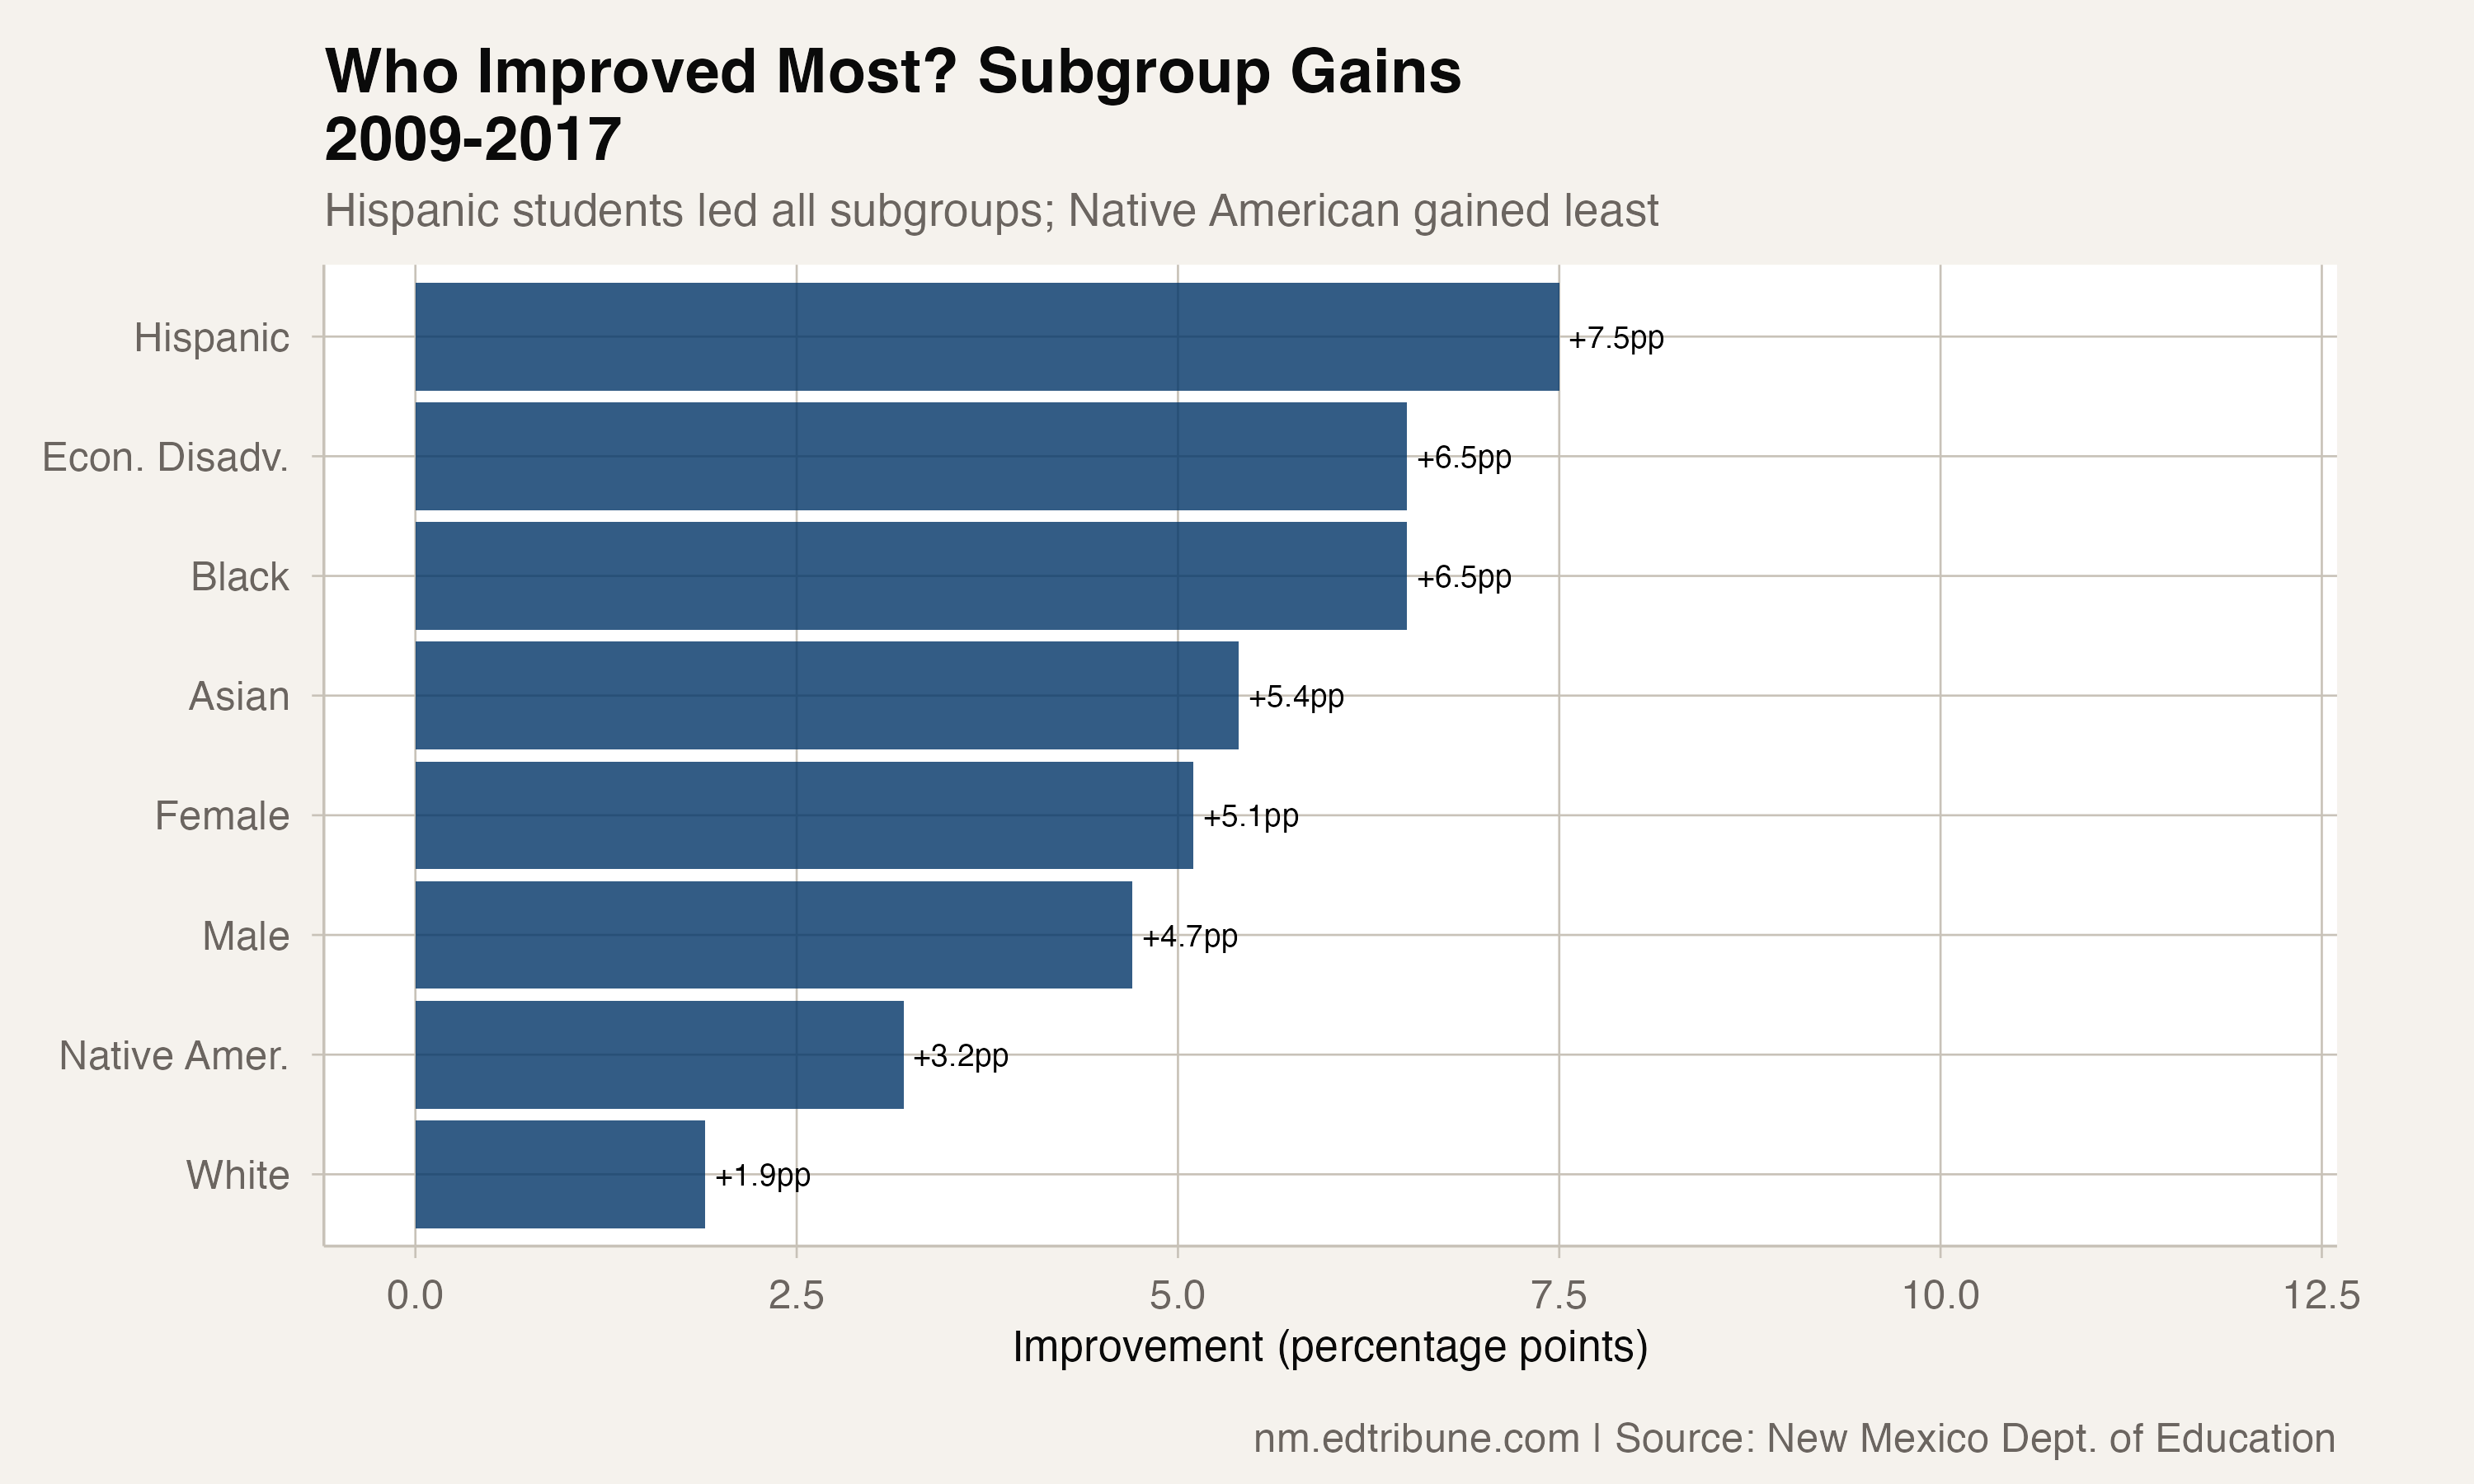
At the bottom of the improvement list: Native American students gained just 3.2 points (57.8% to 61.0%), and white students gained 1.9 points (74.5% to 76.4%). White students started higher and moved less. Native American students started lowest and moved least.
The male-female gap persisted throughout. In 2017, female students graduated at 75.1%, male students at 67.2%. Boys' graduation rate was slightly higher than the 66.4% rate for economically disadvantaged students.
A state of contrasts
The state average pulls together 90 districts that range from 100% to below 50%.
In 2017, 21 districts graduated above 85% -- nearly all of them small rural districts where a graduating class might number in the single digits. At the other end, 26 districts graduated below 70%, including Albuquerque Public Schools↗ET at 67.9%, the state's largest district by a wide margin.
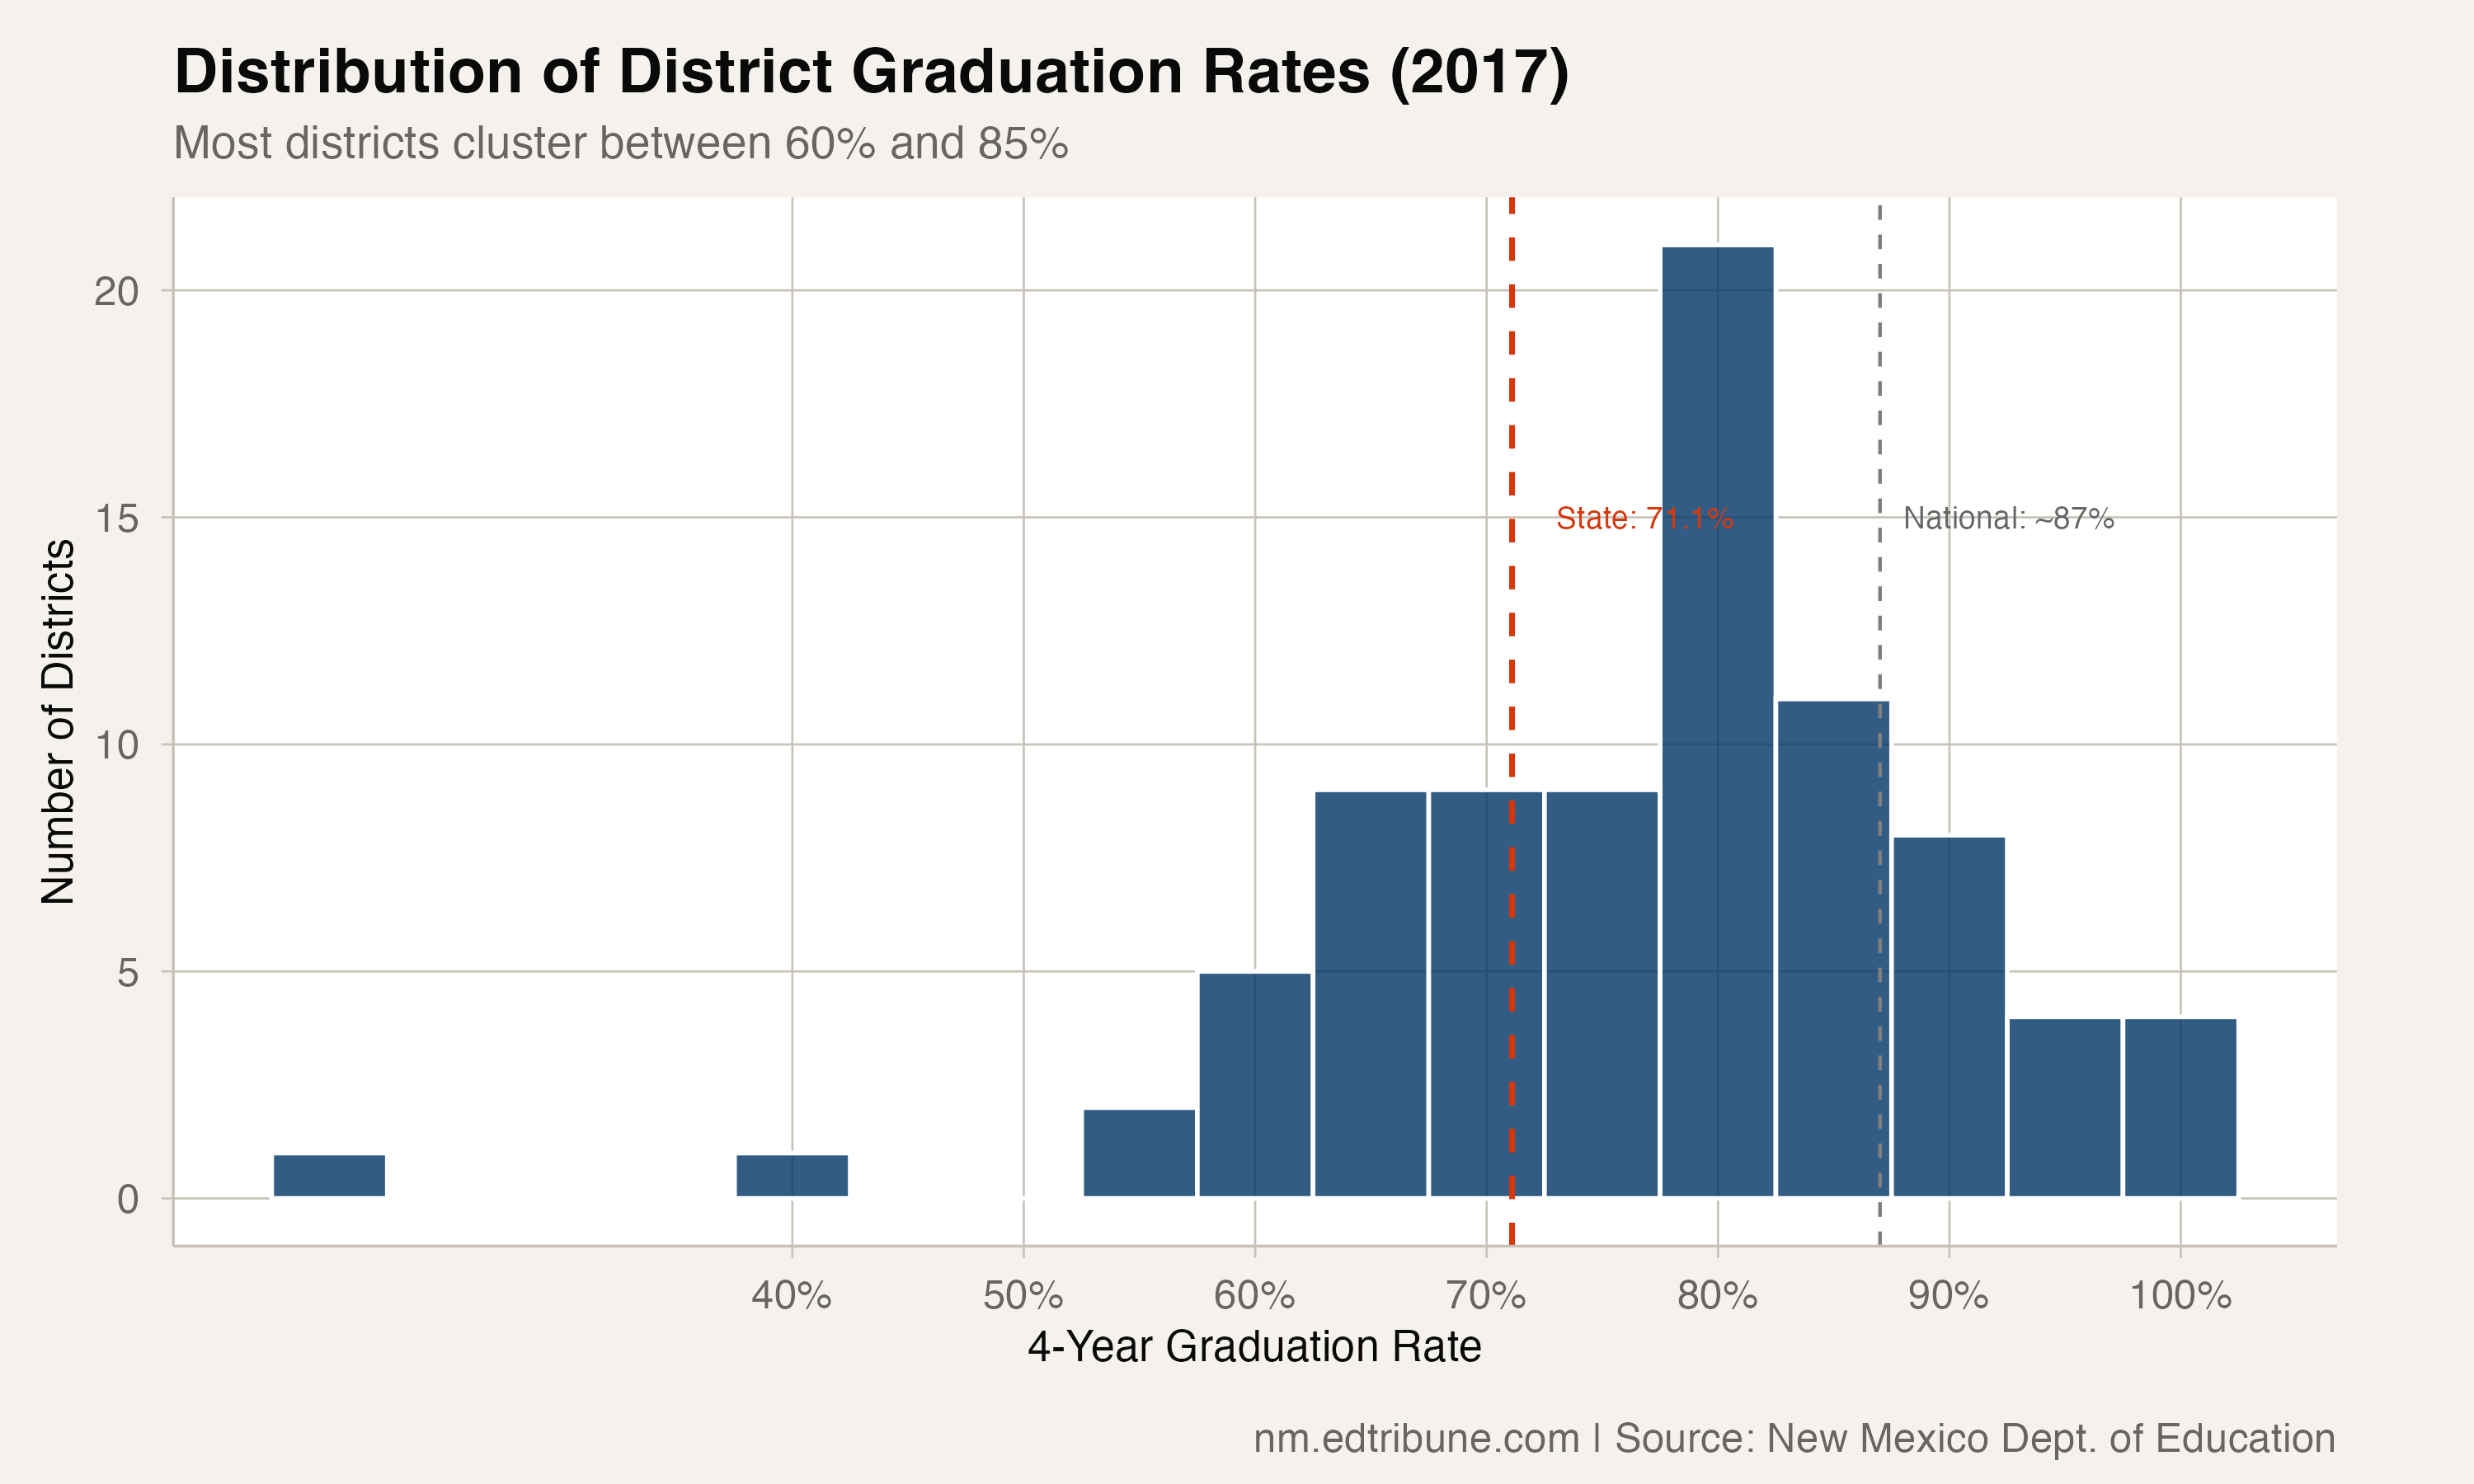
The median district graduated at 78.6%, well above the state average. That gap between the median and the mean reflects the outsized weight of Albuquerque↗ET, which educates roughly a third of the state's students and sits below the state average. When the state's largest district underperforms, it drags down the statewide number disproportionately.
Two large districts broke the pattern. Las Cruces Public Schools↗ET, the state's second-largest, climbed from 64.9% in 2009 to 85.5% in 2017, a 20.6-point improvement that made it the highest-performing large district in the state. Hobbs Municipal Schools↗ET, a Permian Basin oil town, went from 69.4% to 86.1%.
The 75% threshold New Mexico never reached
New Mexico never crossed 75% during the data window. The state reached 70% and then spent five years stuck there. That 70-75% range -- between "most students graduate" and "three-quarters graduate" -- proved harder to push through than the climb from 66%.
More recent data from the New Mexico Public Education Department shows the state reached 80.6% for the Class of 2025. That suggests the rate accelerated significantly after our data window ends, during a period that included the Yazzie/Martinez ruling and a substantial increase in state education funding.
The question the data through 2017 cannot answer is what finally broke the plateau -- whether it was the additional funding, the court mandate, pandemic-era policy changes, or some combination. What the data does show is that the first eight years of ACGR measurement produced five points of improvement and a prolonged stall.
At 71.1%, New Mexico in 2017 was roughly where the national average had been a decade earlier. The gap was not closing so much as the state was running the same race on a significant delay.
Data from the New Mexico Public Education Department. Graduation rates are 4-year Adjusted Cohort Graduation Rates (ACGR) for cohorts 2009-2017. National average from NCES.
Detailed code that reproduces the analysis and figures in this article is available exclusively to EdTribune subscribers.
Discussion
Sign in to join the discussion.
Loading comments...