The standard measure of graduation success is the four-year rate. But New Mexico also tracks five-year and six-year rates, and the gap between them tells a story about who is close to graduating and who is being left behind by the four-year clock.
For the Class of 2016, Black students gained 7.0 percentage points when given a fifth year, moving from 61.0% to 68.0%. That was the largest gain of any subgroup. Native American students gained 5.8 points. Economically disadvantaged students gained 5.5. White students gained 4.3.
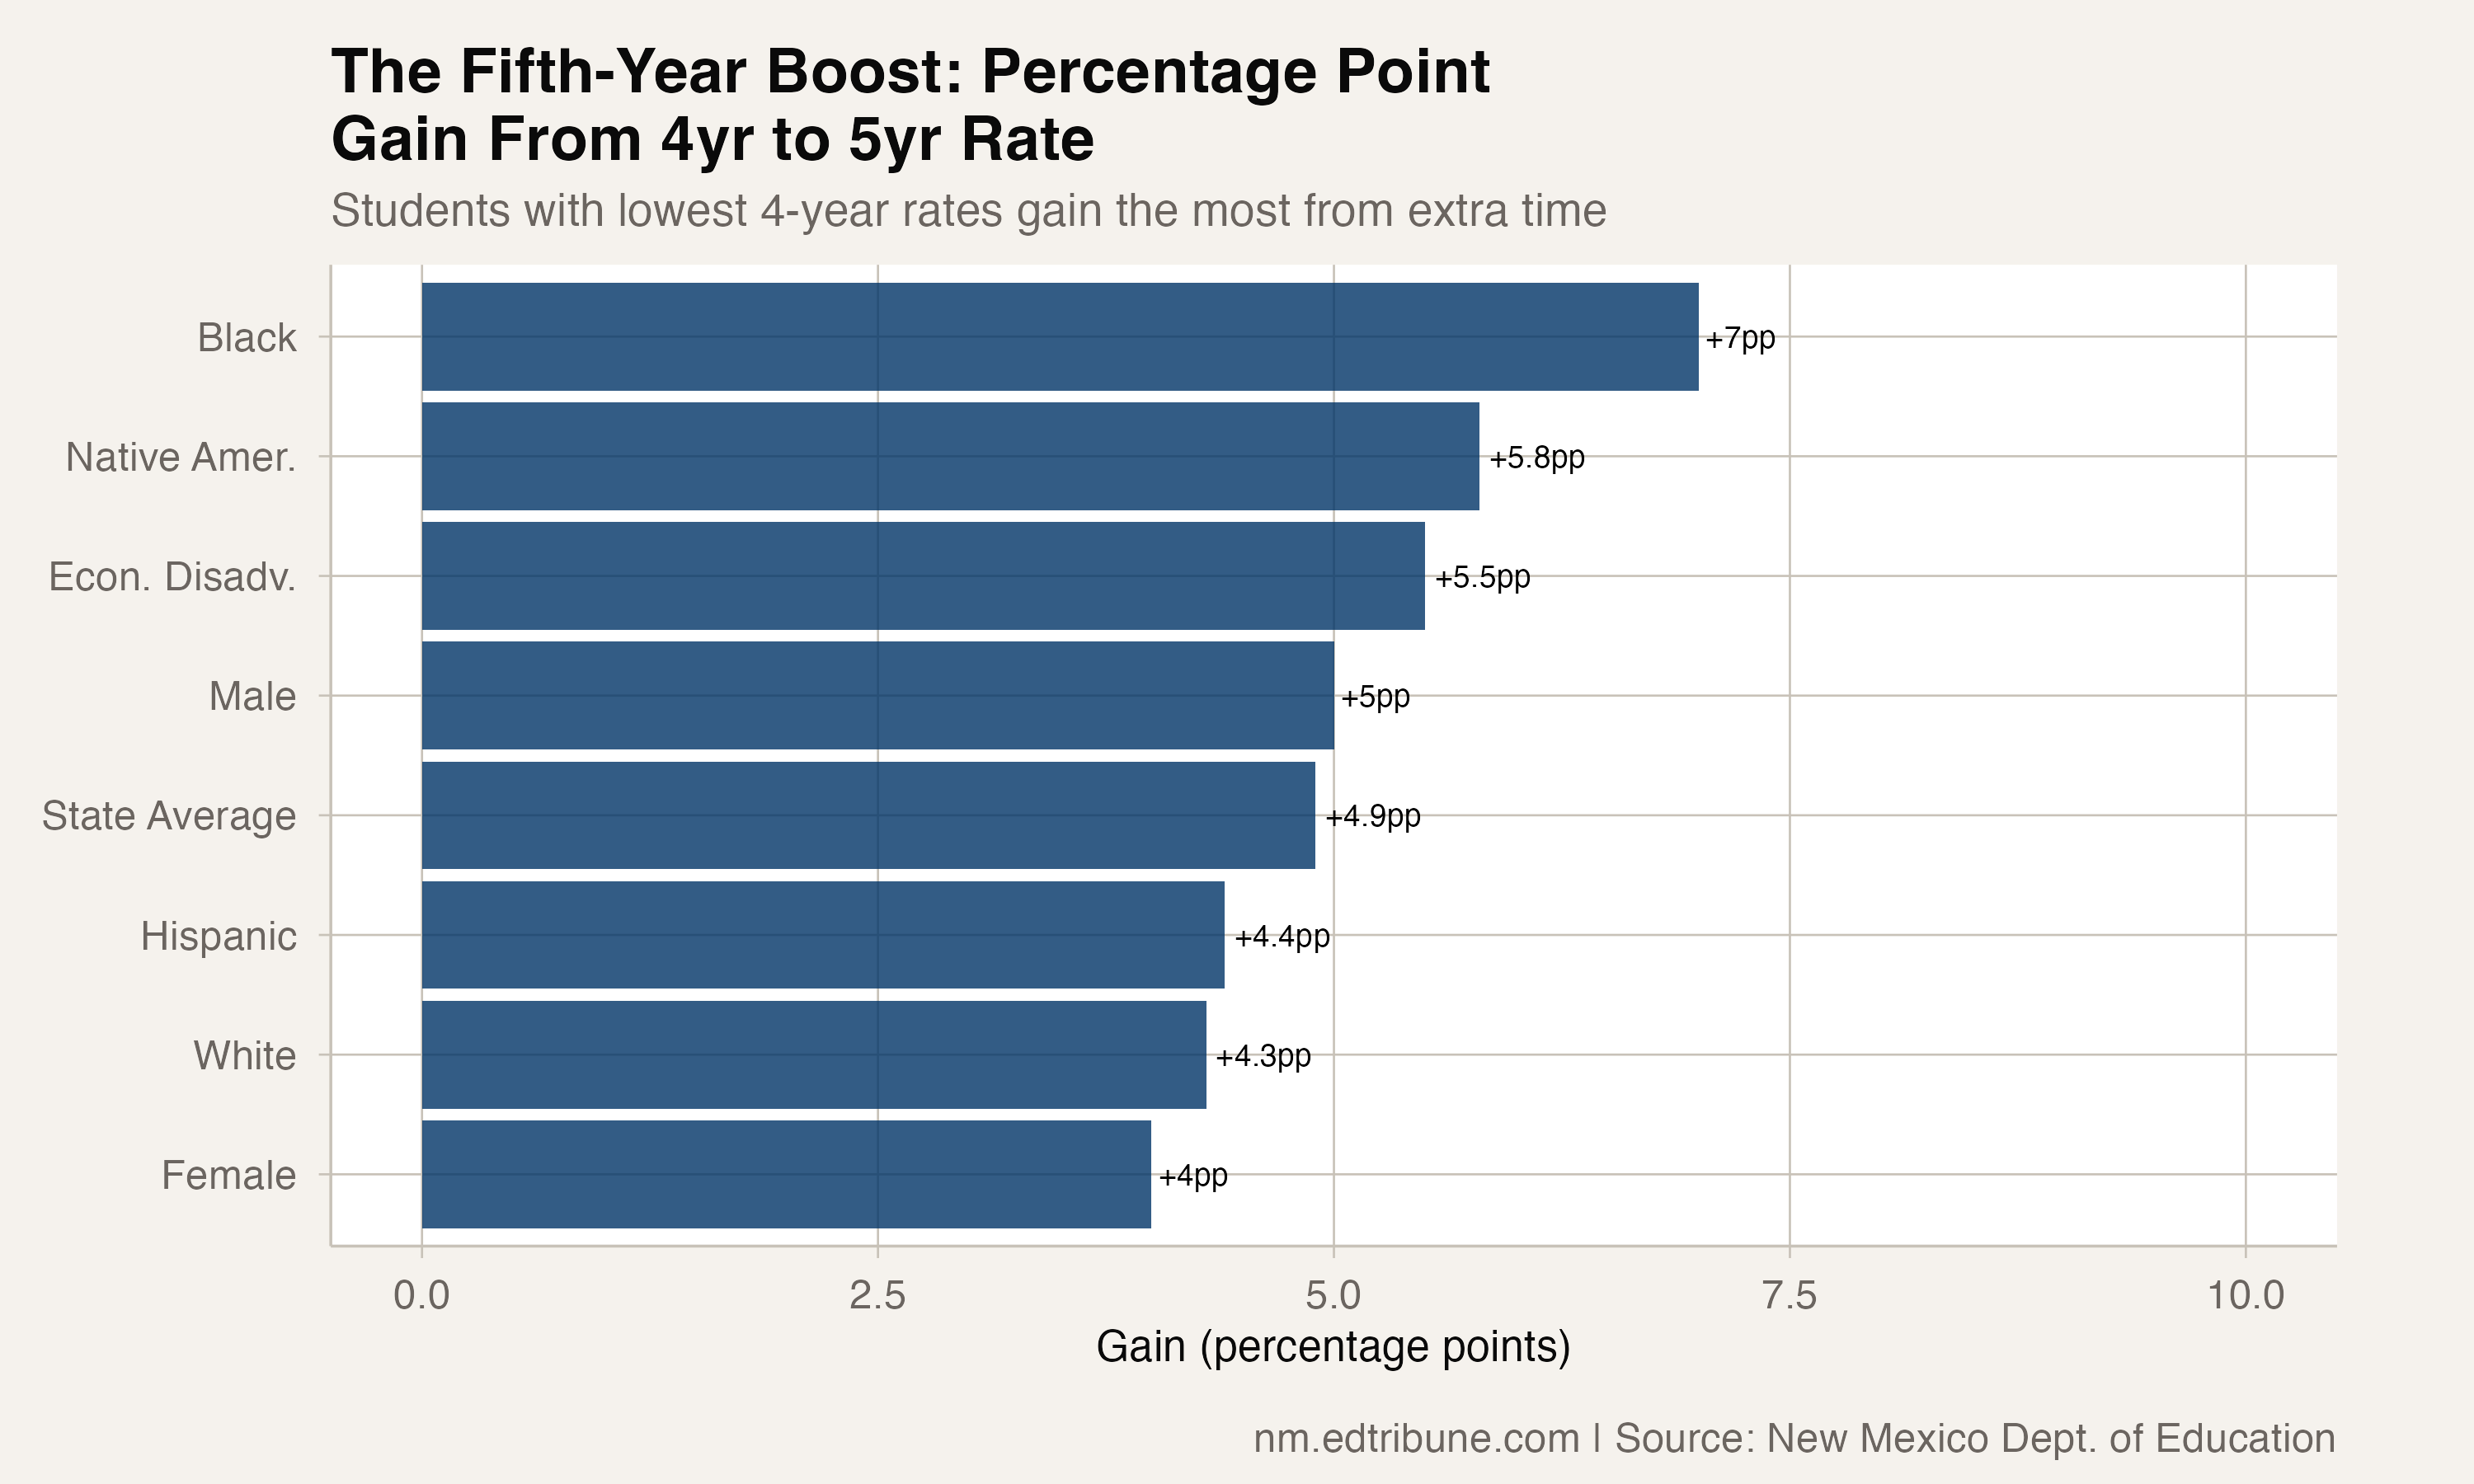
The pattern is consistent: the groups with the lowest four-year rates benefit most from additional time.
The inverse relationship
The subgroup data reveals a near-perfect inverse correlation between four-year rates and fifth-year gains. Students who struggle most to finish in four years are not simply dropping out. Many are staying in school and finishing one year late.
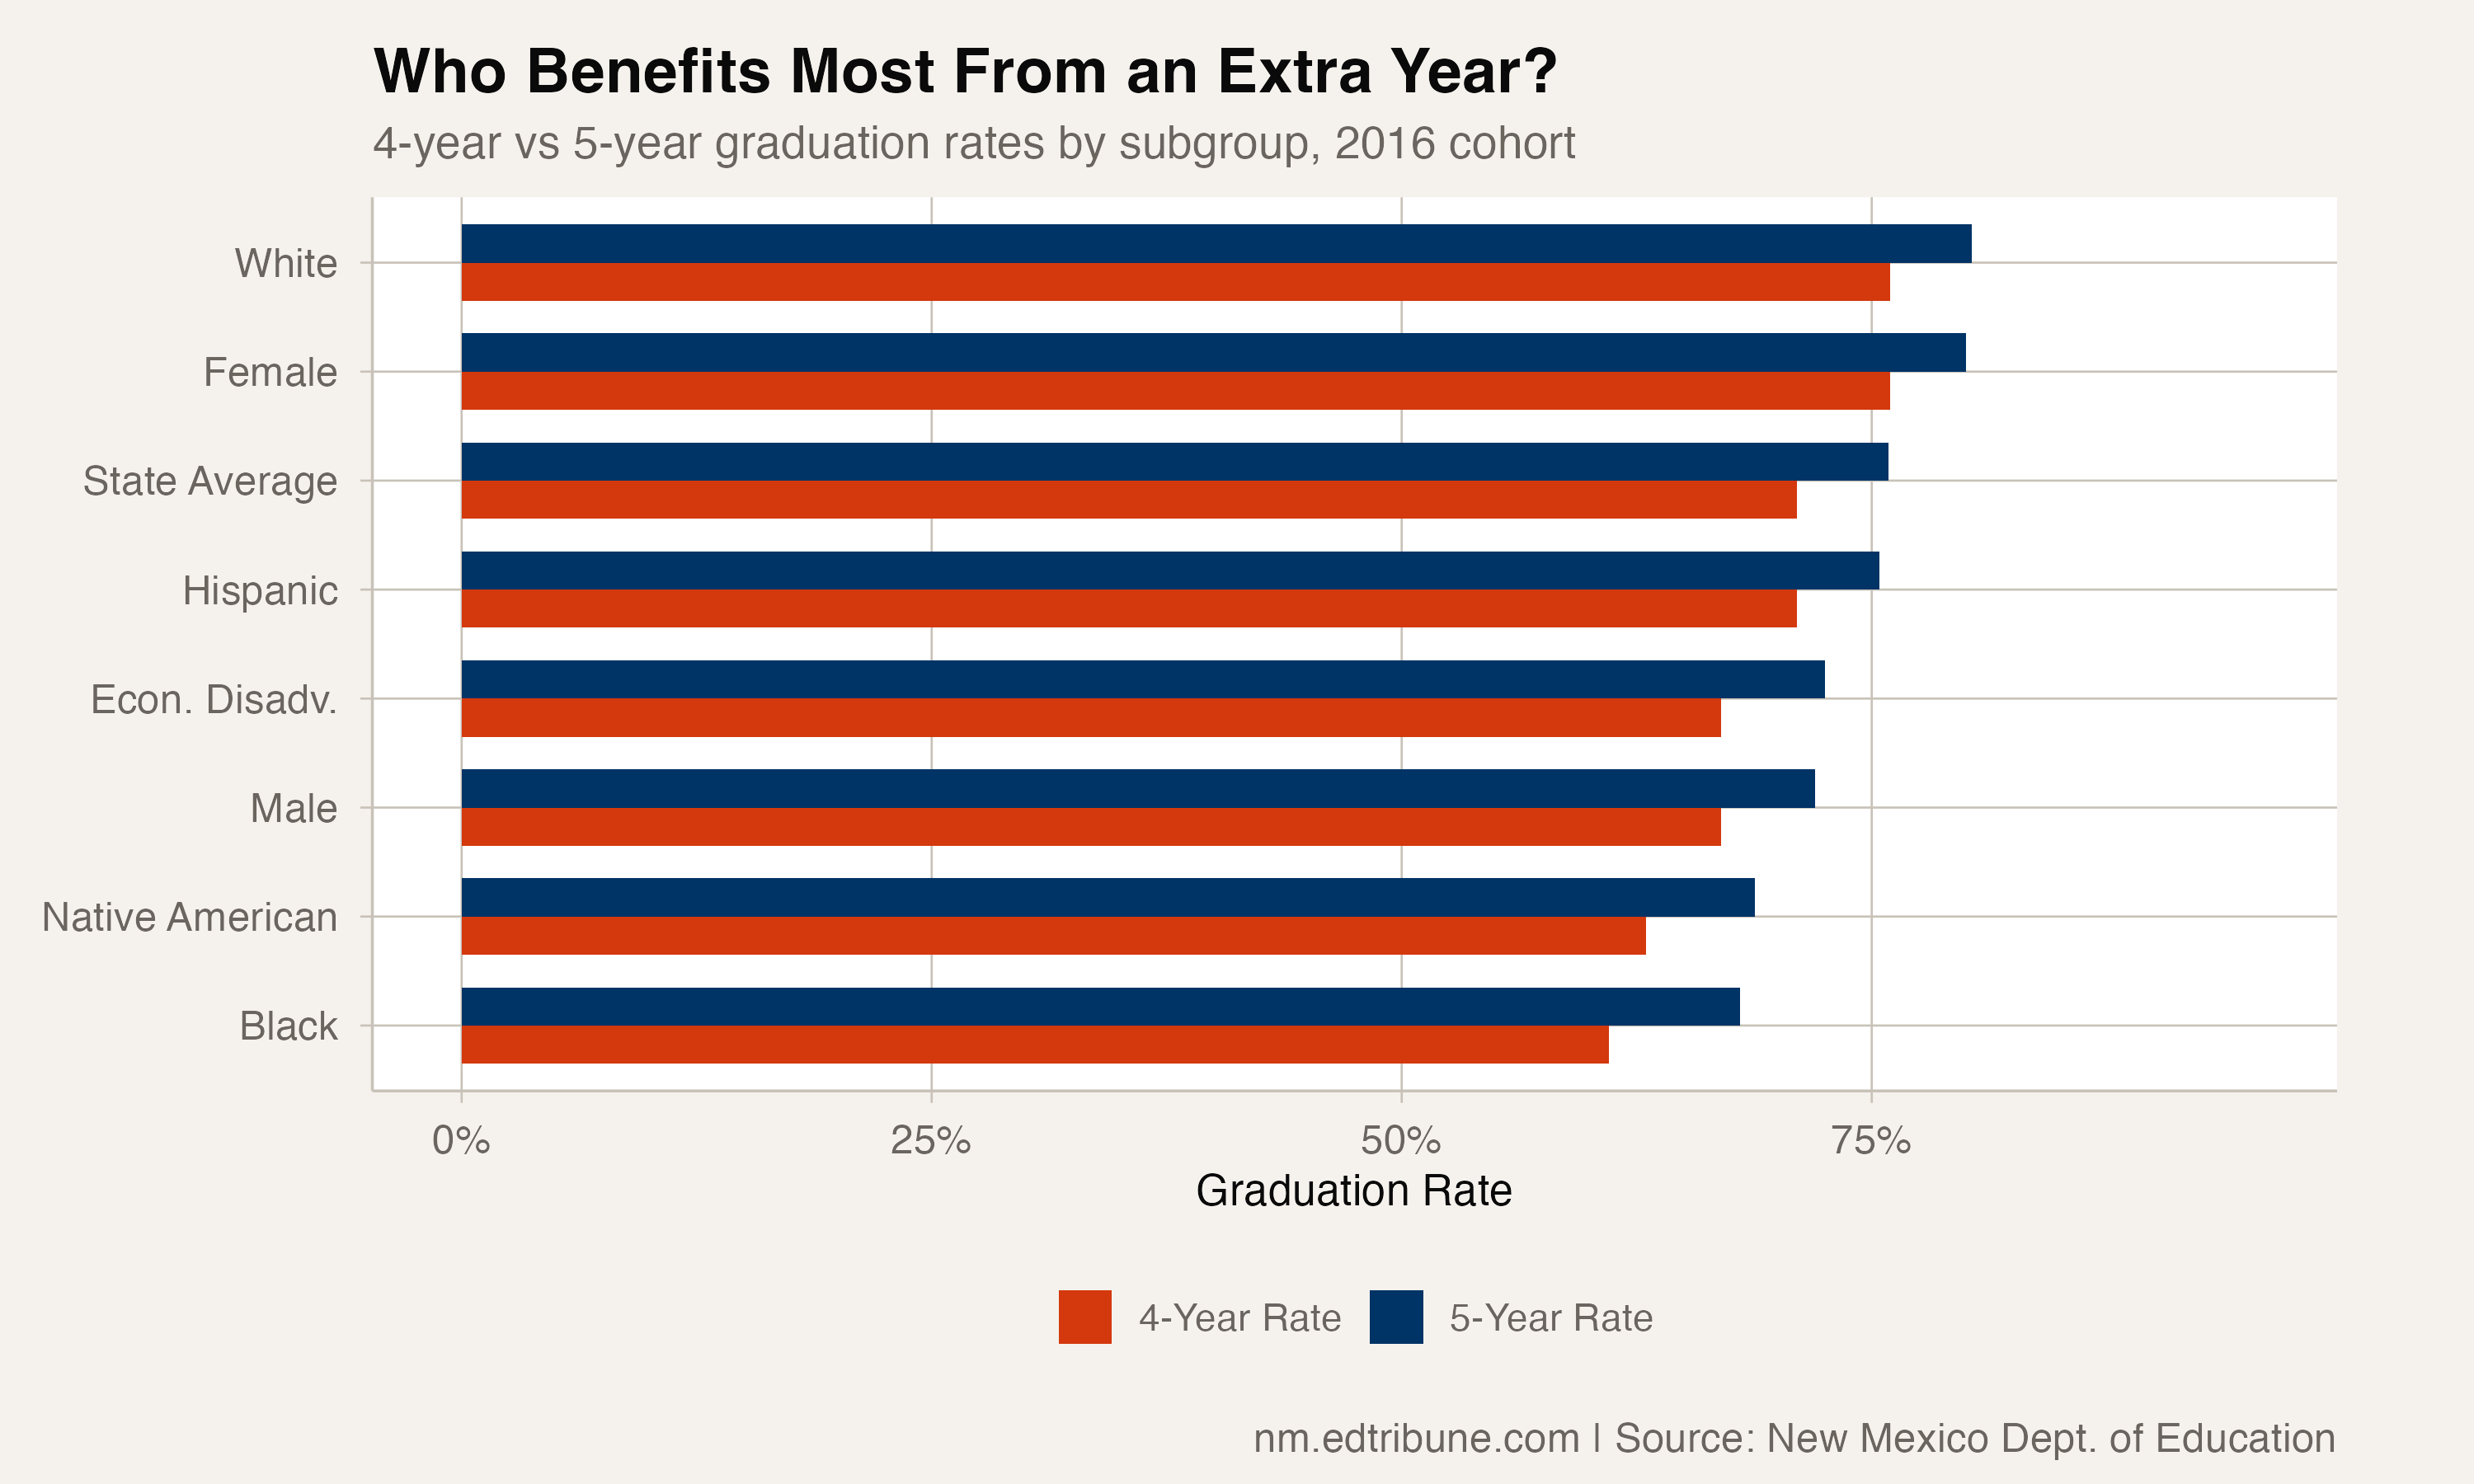
Black students start at 61.0% and reach 68.0% with a fifth year. Native American students go from 63.0% to 68.8%. Male students move from 67.0% to 72.0%. At the top end, female students go from 76.0% to 80.0%, a four-point gain, and white students from 76.0% to 80.3%.
The five-year rate narrows, but does not close, the equity gaps. The 13-point gap between white and Native American four-year rates (76% vs. 63%) shrinks to 11.5 points at the five-year mark (80.3% vs. 68.8%). The gap between white and Black students narrows from 15 to 12.3 points.
Compounding with a sixth year
For the 2014 cohort, which has six-year rate data available, the state's overall graduation rate went from 69.3% (four-year) to 70.5% (five-year) to 79.0% (six-year).
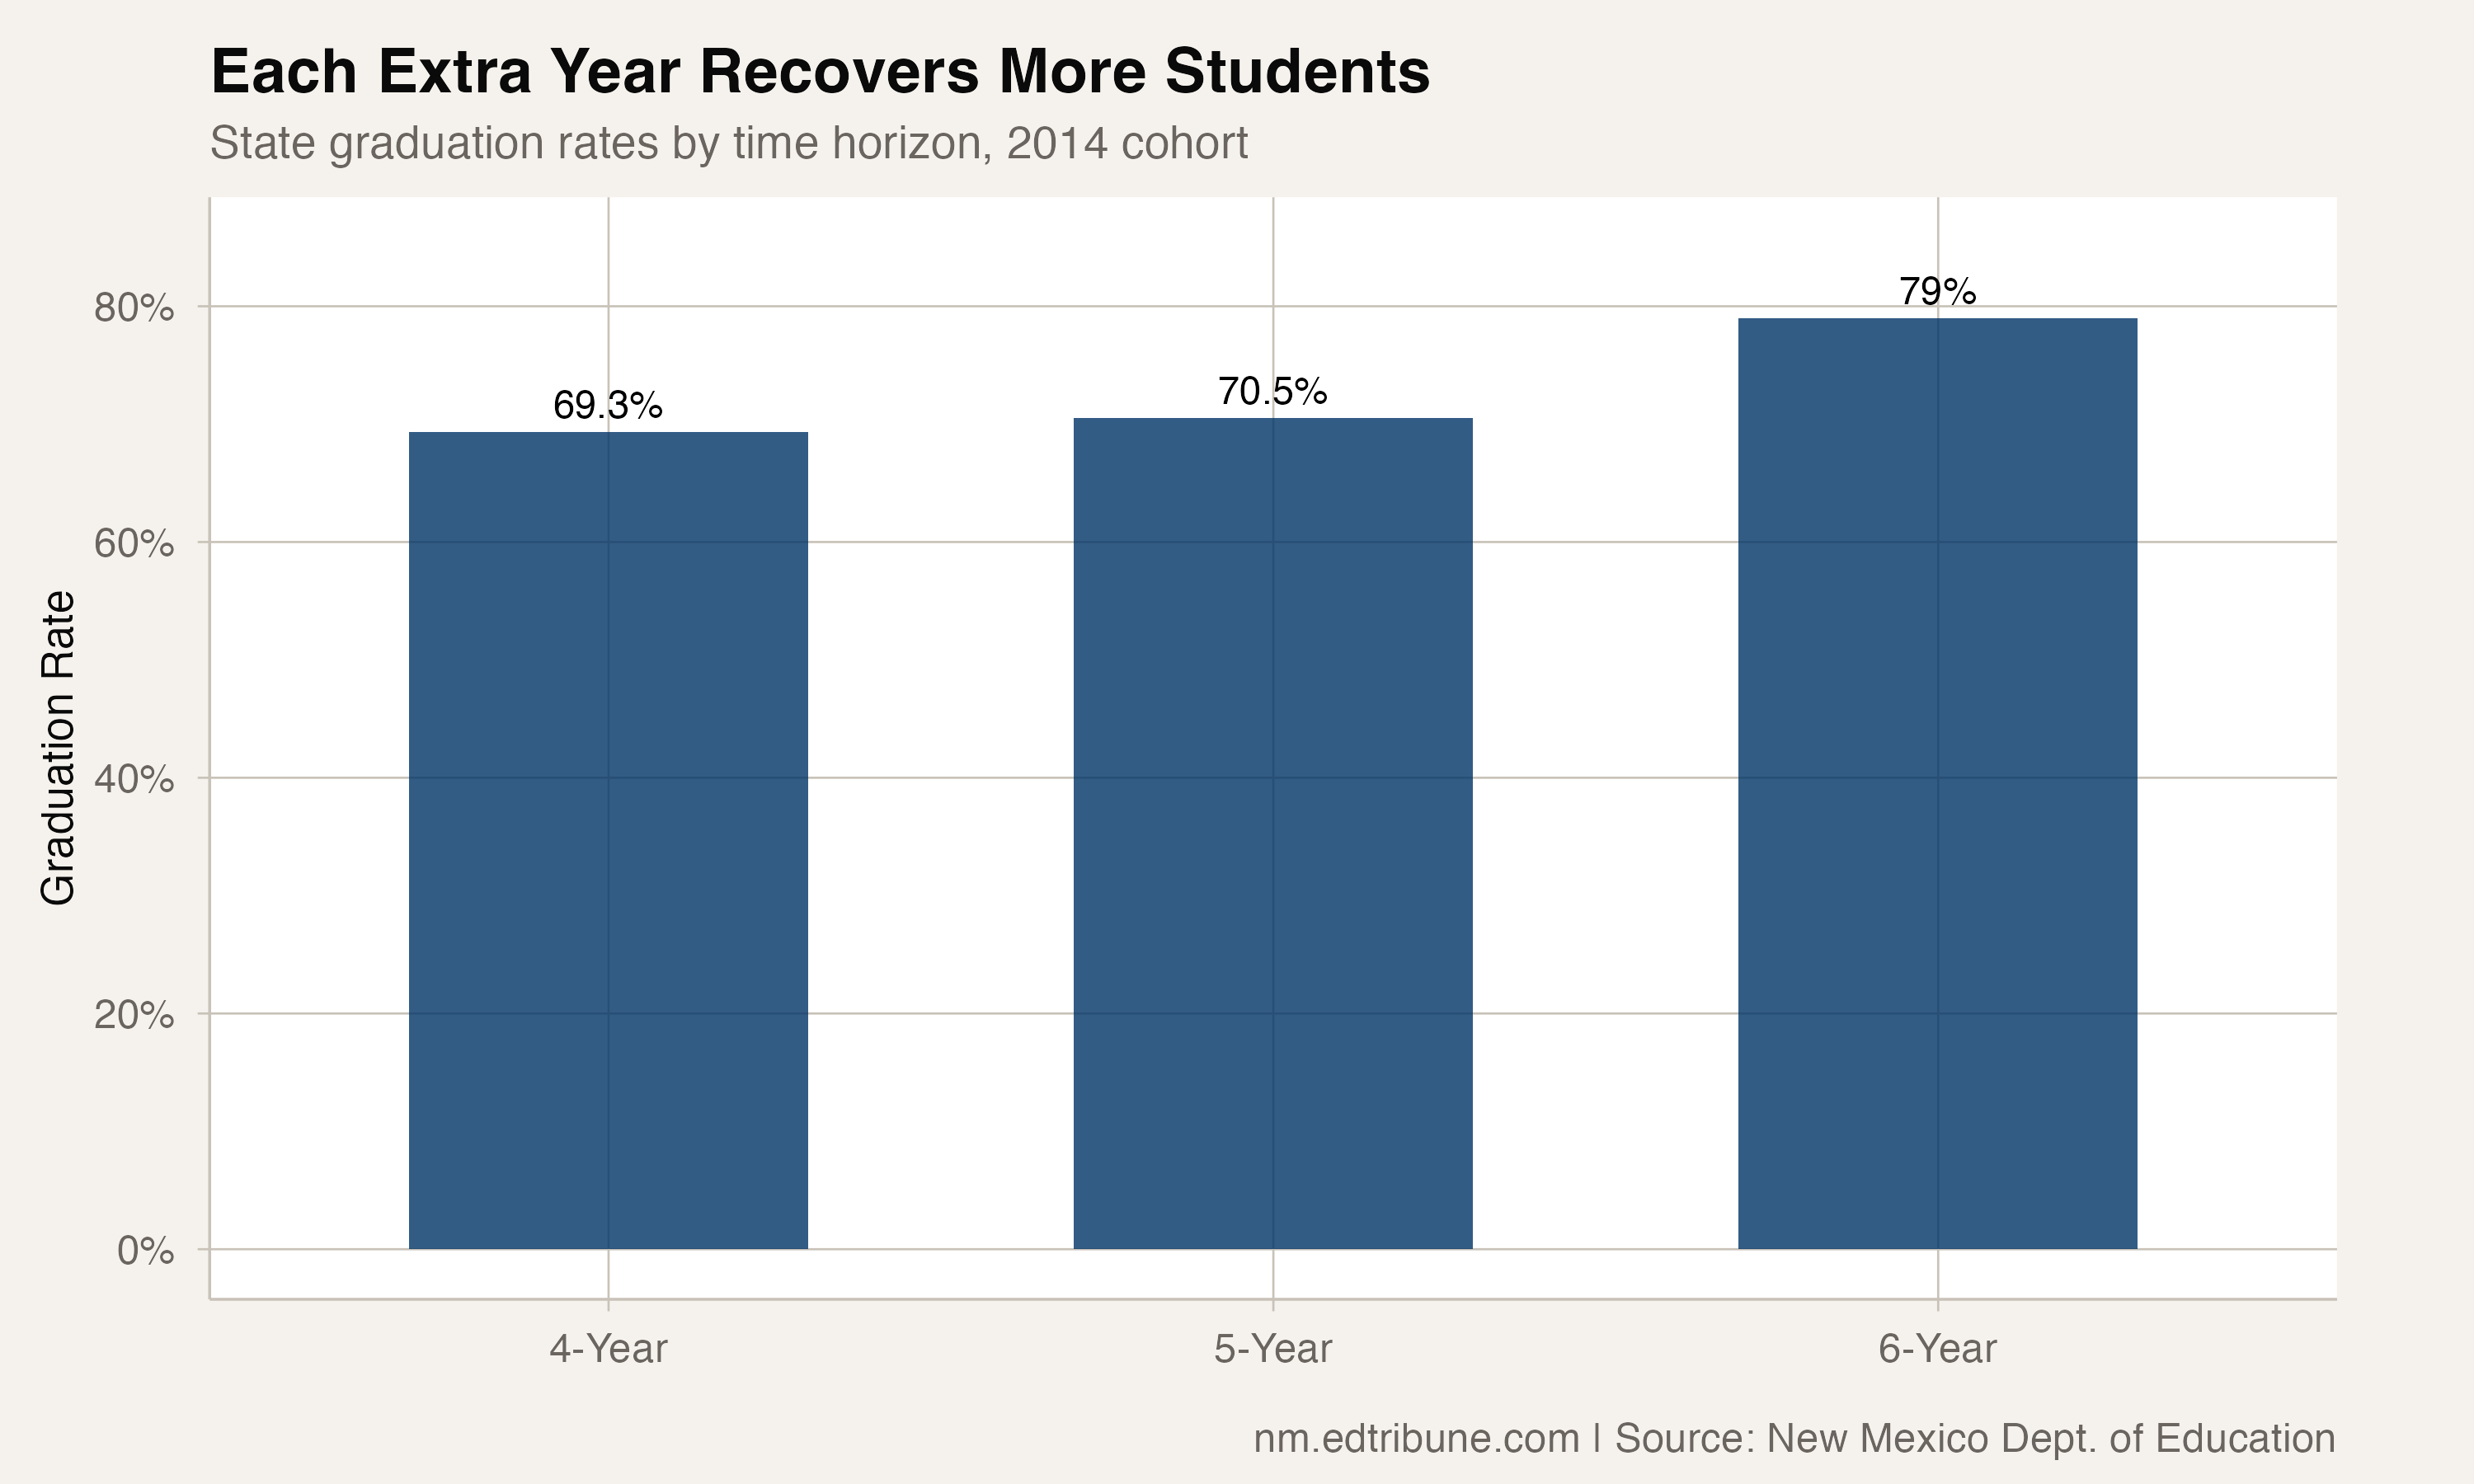
The six-year jump of 8.5 points from the five-year rate is notably larger than the 1.2-point five-year gain from the four-year rate for this cohort. The 2014 cohort's five-year rate appears unusually compressed (other cohort years show more typical four-to-five-year gains), but the six-year rate suggests a substantial group of students who need two additional years rather than one.
At the six-year mark, nearly four in five students in the 2014 cohort had graduated. That 79.0% rate approaches where the national four-year average was at the time, raising the question of whether New Mexico's graduation challenge is partly a timing problem rather than purely a completion problem.
What this means for accountability
New Mexico's ESSA state plan includes four-year, five-year, and six-year graduation rates in its school accountability system. This is one of the more nuanced approaches in the country; many states weight only the four-year rate.
The data supports that approach. A district where 61% of Black students graduate in four years but 68% graduate in five is a different place than one where 61% graduate and the rest disappear from the system entirely. The five-year data suggests that these students are persisting. They are taking longer, but they are finishing.
The policy question is what kind of support could convert fifth-year graduates into fourth-year graduates, or whether the emphasis on the four-year timeline itself creates a framework that penalizes schools serving students who need more time. Students who transfer between schools, who miss significant instructional time, or who are learning English while completing coursework may be on a path to graduation that simply does not fit a four-year window.
The limits of extended-rate data
The five-year and six-year rate data in New Mexico is available only at the state level for a limited range of cohorts (five-year: 2012-2016, six-year: 2010-2015). District-level extended rates are not available in the state data, which means it is impossible to know whether the subgroup patterns hold across different communities.
Cohort counts are also unavailable (every cell is blank), so the rates cannot be converted to absolute numbers. How many additional Black students graduated in year five? How many Native American students? The percentages suggest the numbers are meaningful, but the actual count is unknown.
The four-year rate undercounts graduation for exactly the students who most need to be counted. For Black and Native American students in New Mexico, the fifth year is not a consolation prize. It is how a significant share of them earn diplomas.
Data from the New Mexico Public Education Department. Four-year and five-year rates for 2016 cohort; six-year rates for 2014 cohort.
Detailed code that reproduces the analysis and figures in this article is available exclusively to EdTribune subscribers.
Discussion
Sign in to join the discussion.
Loading comments...