Correction (July 20, 2026): The core finding is unchanged: the white-Hispanic graduation gap narrowed from 11.5 to 5.9 percentage points between the 2009 and 2017 cohorts. An earlier version, however, used an unsupported 60% enrollment-share claim to attribute the statewide gain primarily to Hispanic students. It also said the 2016 Hispanic five-year rate remained below where white students started; at 75.4%, it was above the 2009 white four-year rate but 0.6 point below the 2016 white four-year rate. Those claims have been corrected or removed.
Eight years ago, the graduation gap between white and Hispanic students in New Mexico stood at 11.5 percentage points -- white students at 74.5%, Hispanic students at 63.0%.
By 2017, that gap had shrunk to 5.9 points. Not because white students fell, but because Hispanic students climbed 7.5 points to 70.5%, the fastest improvement of any racial group in the state.
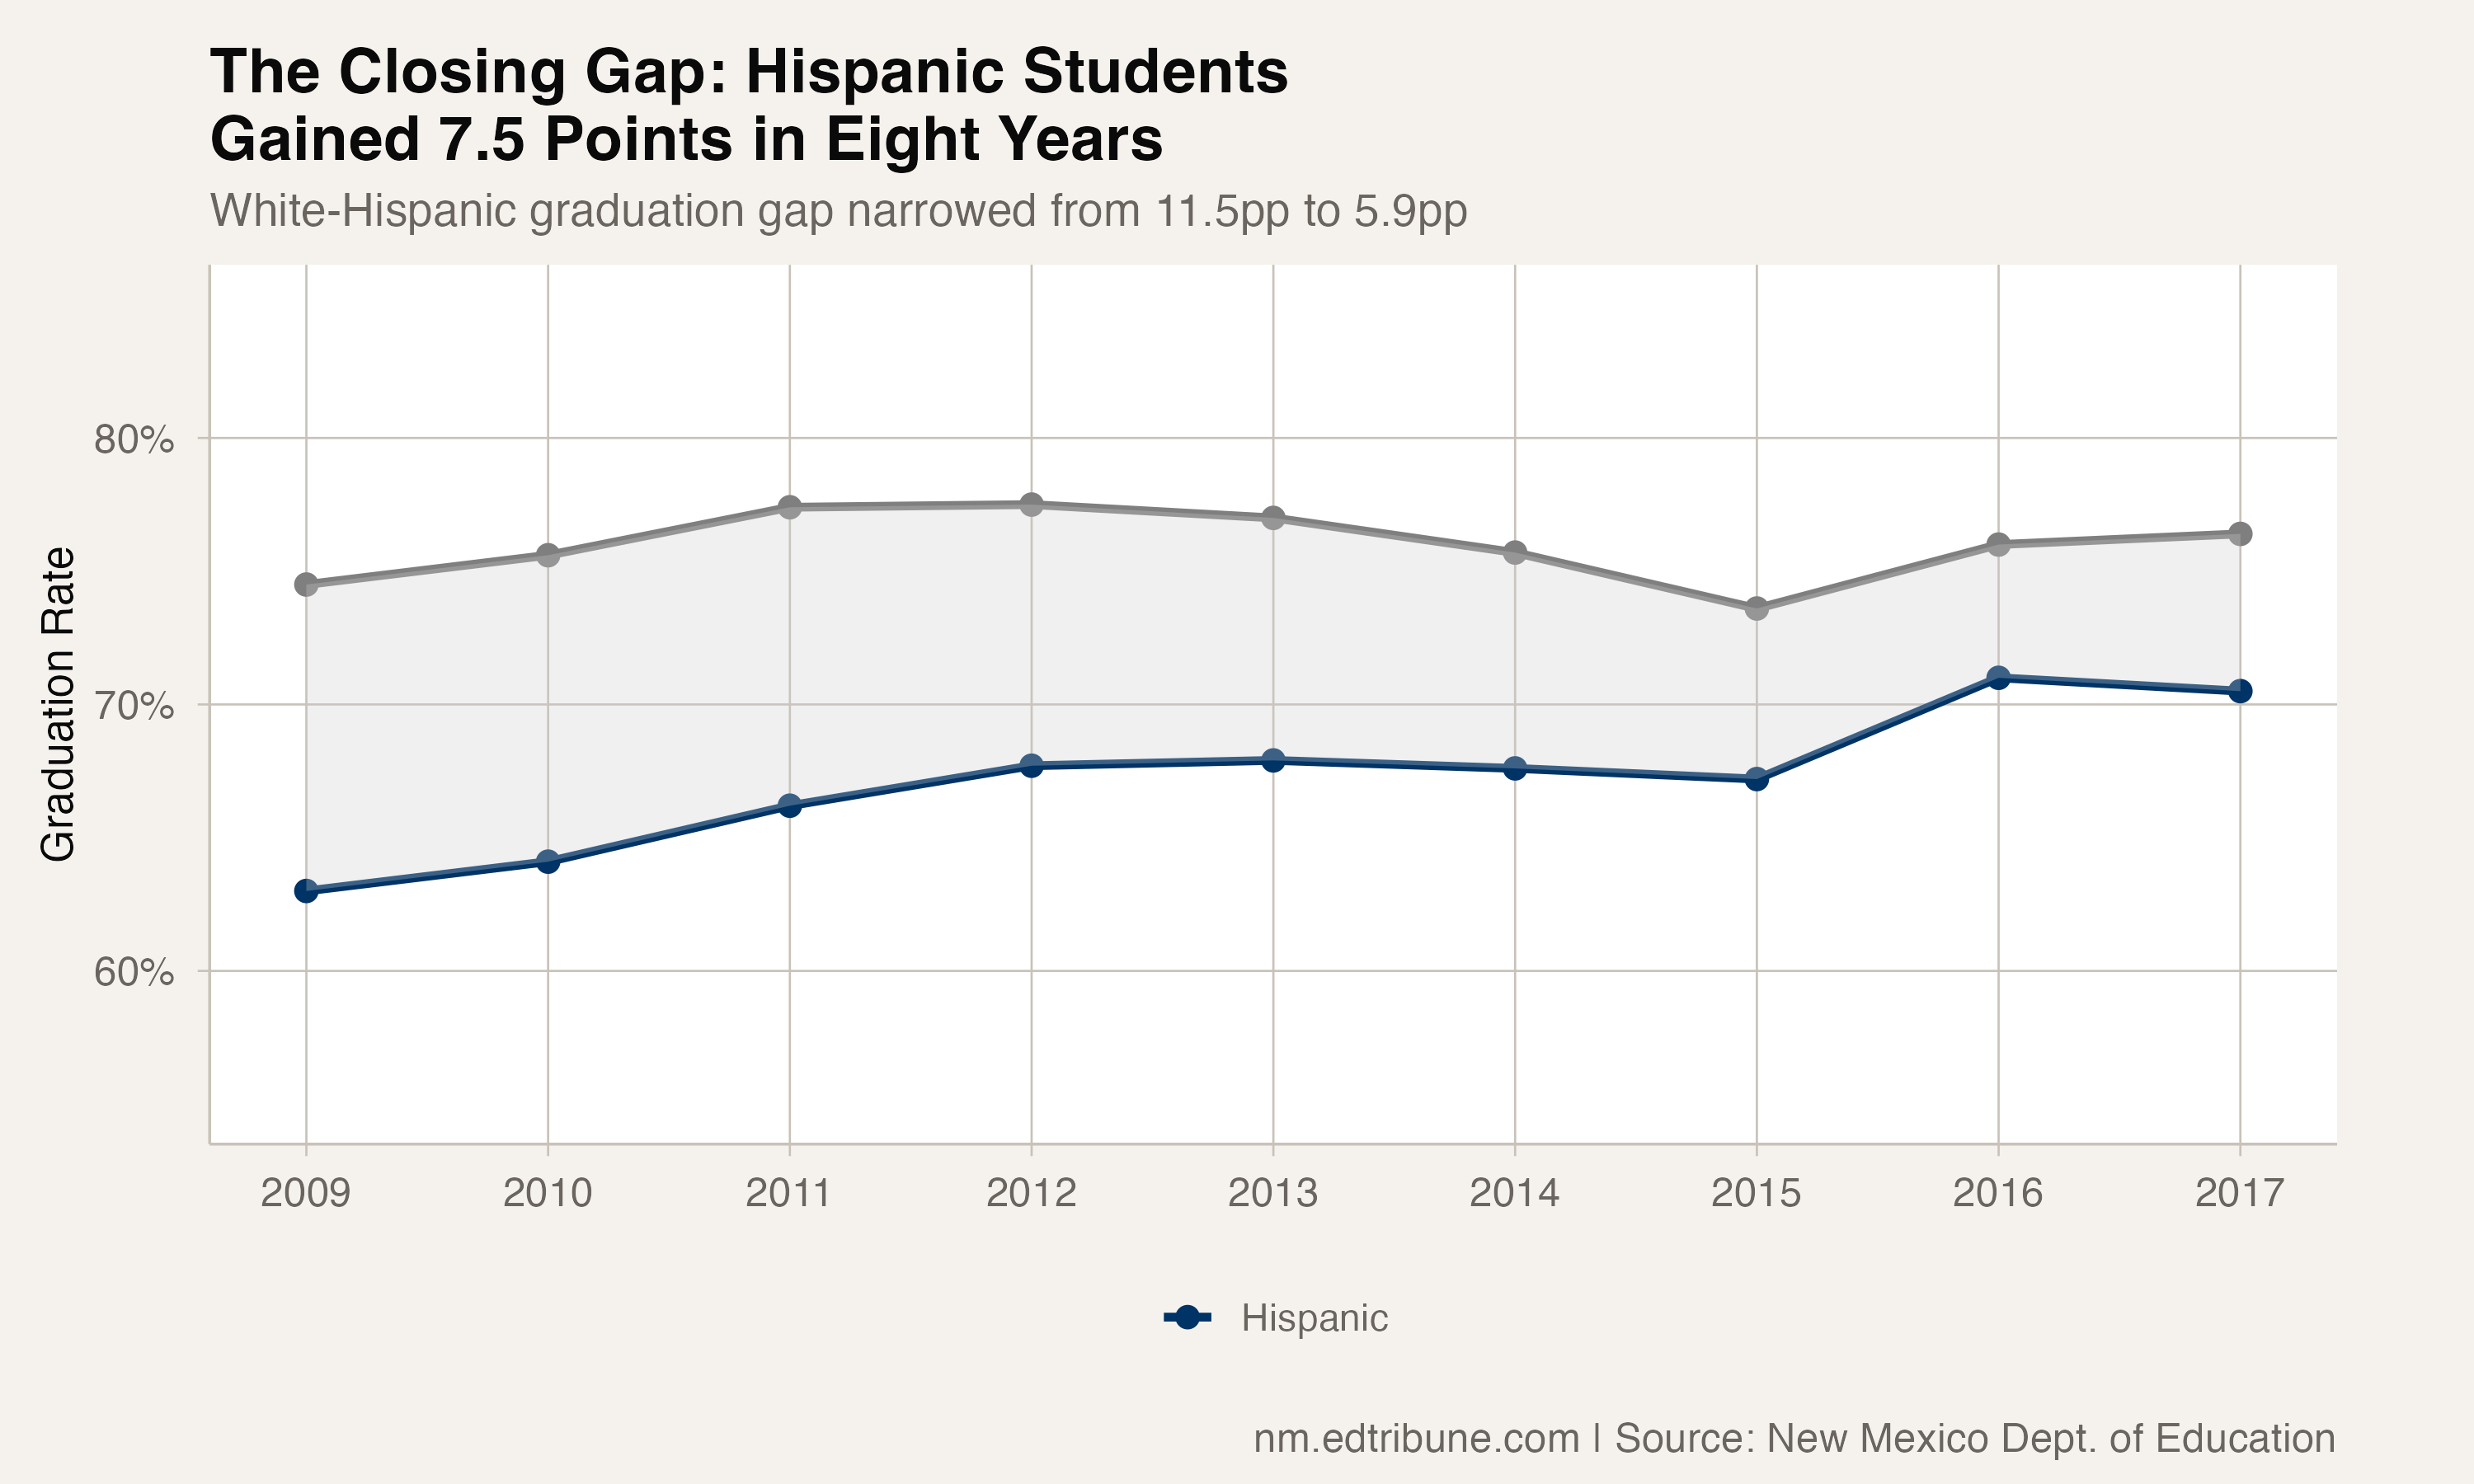
The gap narrowed because Hispanic students improved faster than white students over these endpoints. The graduation files establish that rate comparison but do not contain the enrollment composition needed to assign each subgroup's contribution to the statewide change.
The fastest improvers
Hispanic students gained 7.5 percentage points between 2009 and 2017, the largest improvement of any racial subgroup in the state. Black students gained 6.5 points. Asian students gained 5.4. Native American students gained 3.2. White students, starting from a higher base, gained 1.9.
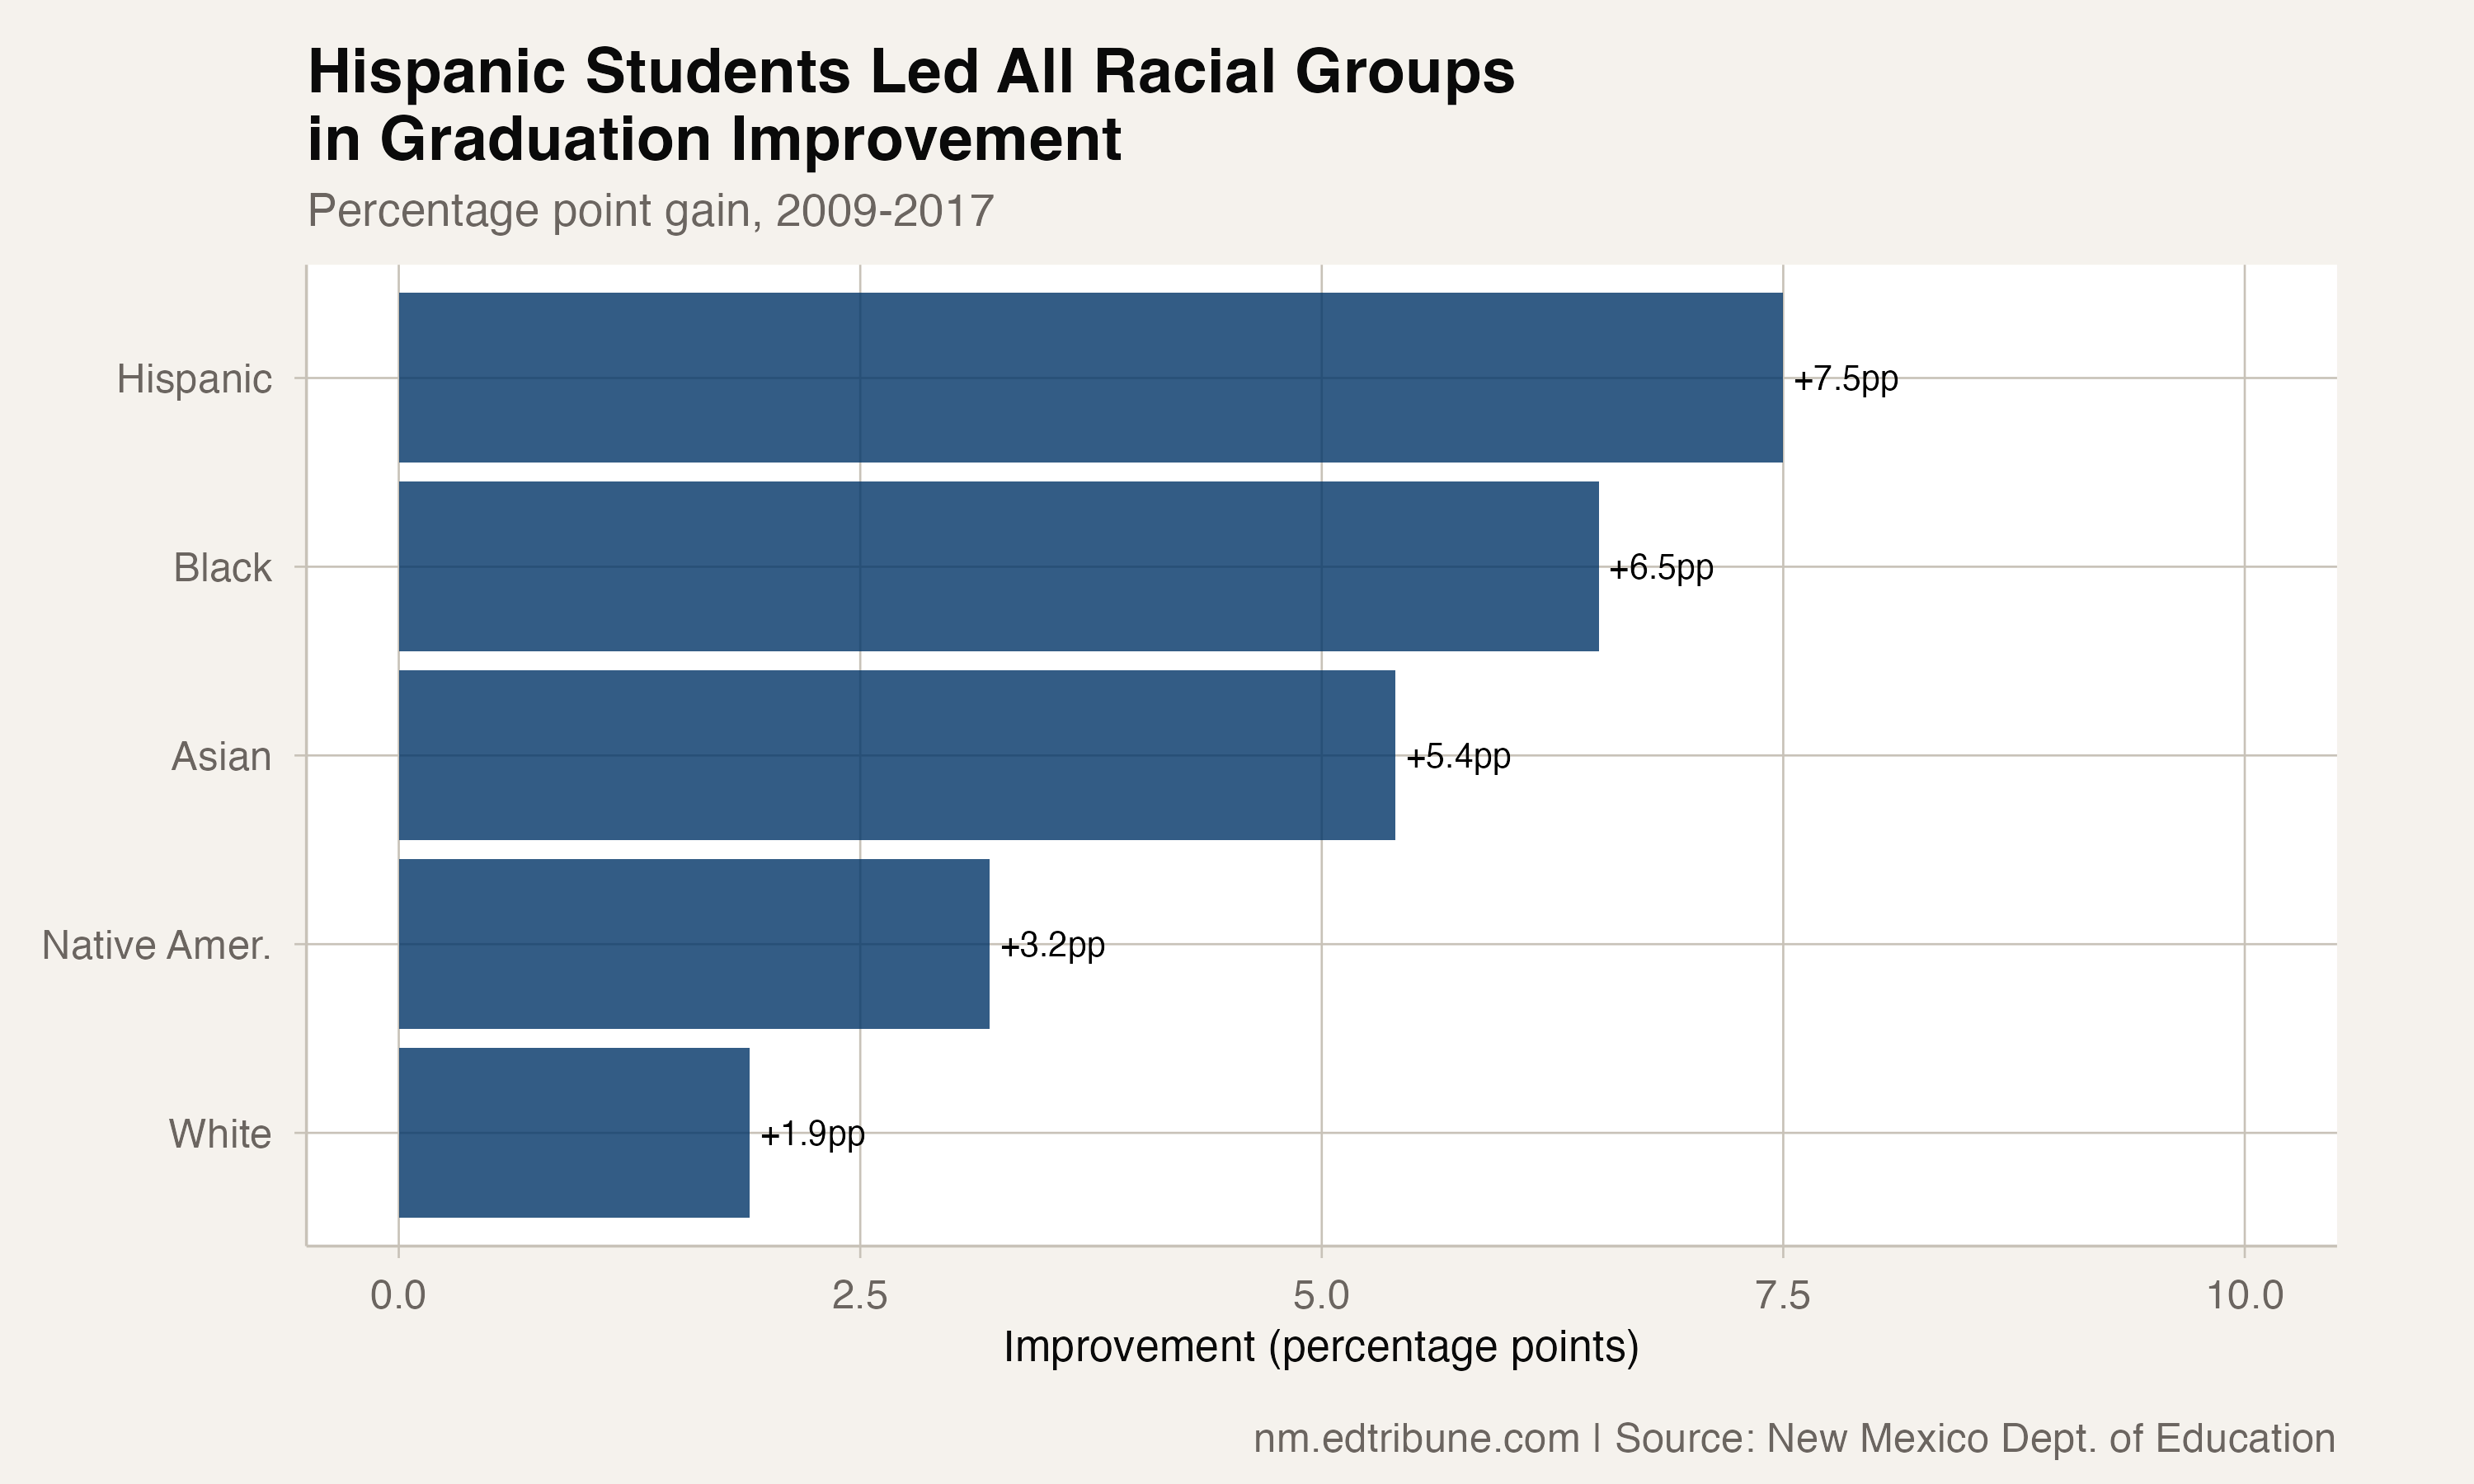
The overall state rate moved from 66.1% to 71.1% over the same cohorts. That parallel movement does not, by itself, prove how much of the statewide increase came from any one subgroup.
The shape of the narrowing
The gap did not narrow at a steady pace. It held essentially flat at 11.5 points from 2009 through 2010, then began closing as Hispanic students improved while white rates leveled off.
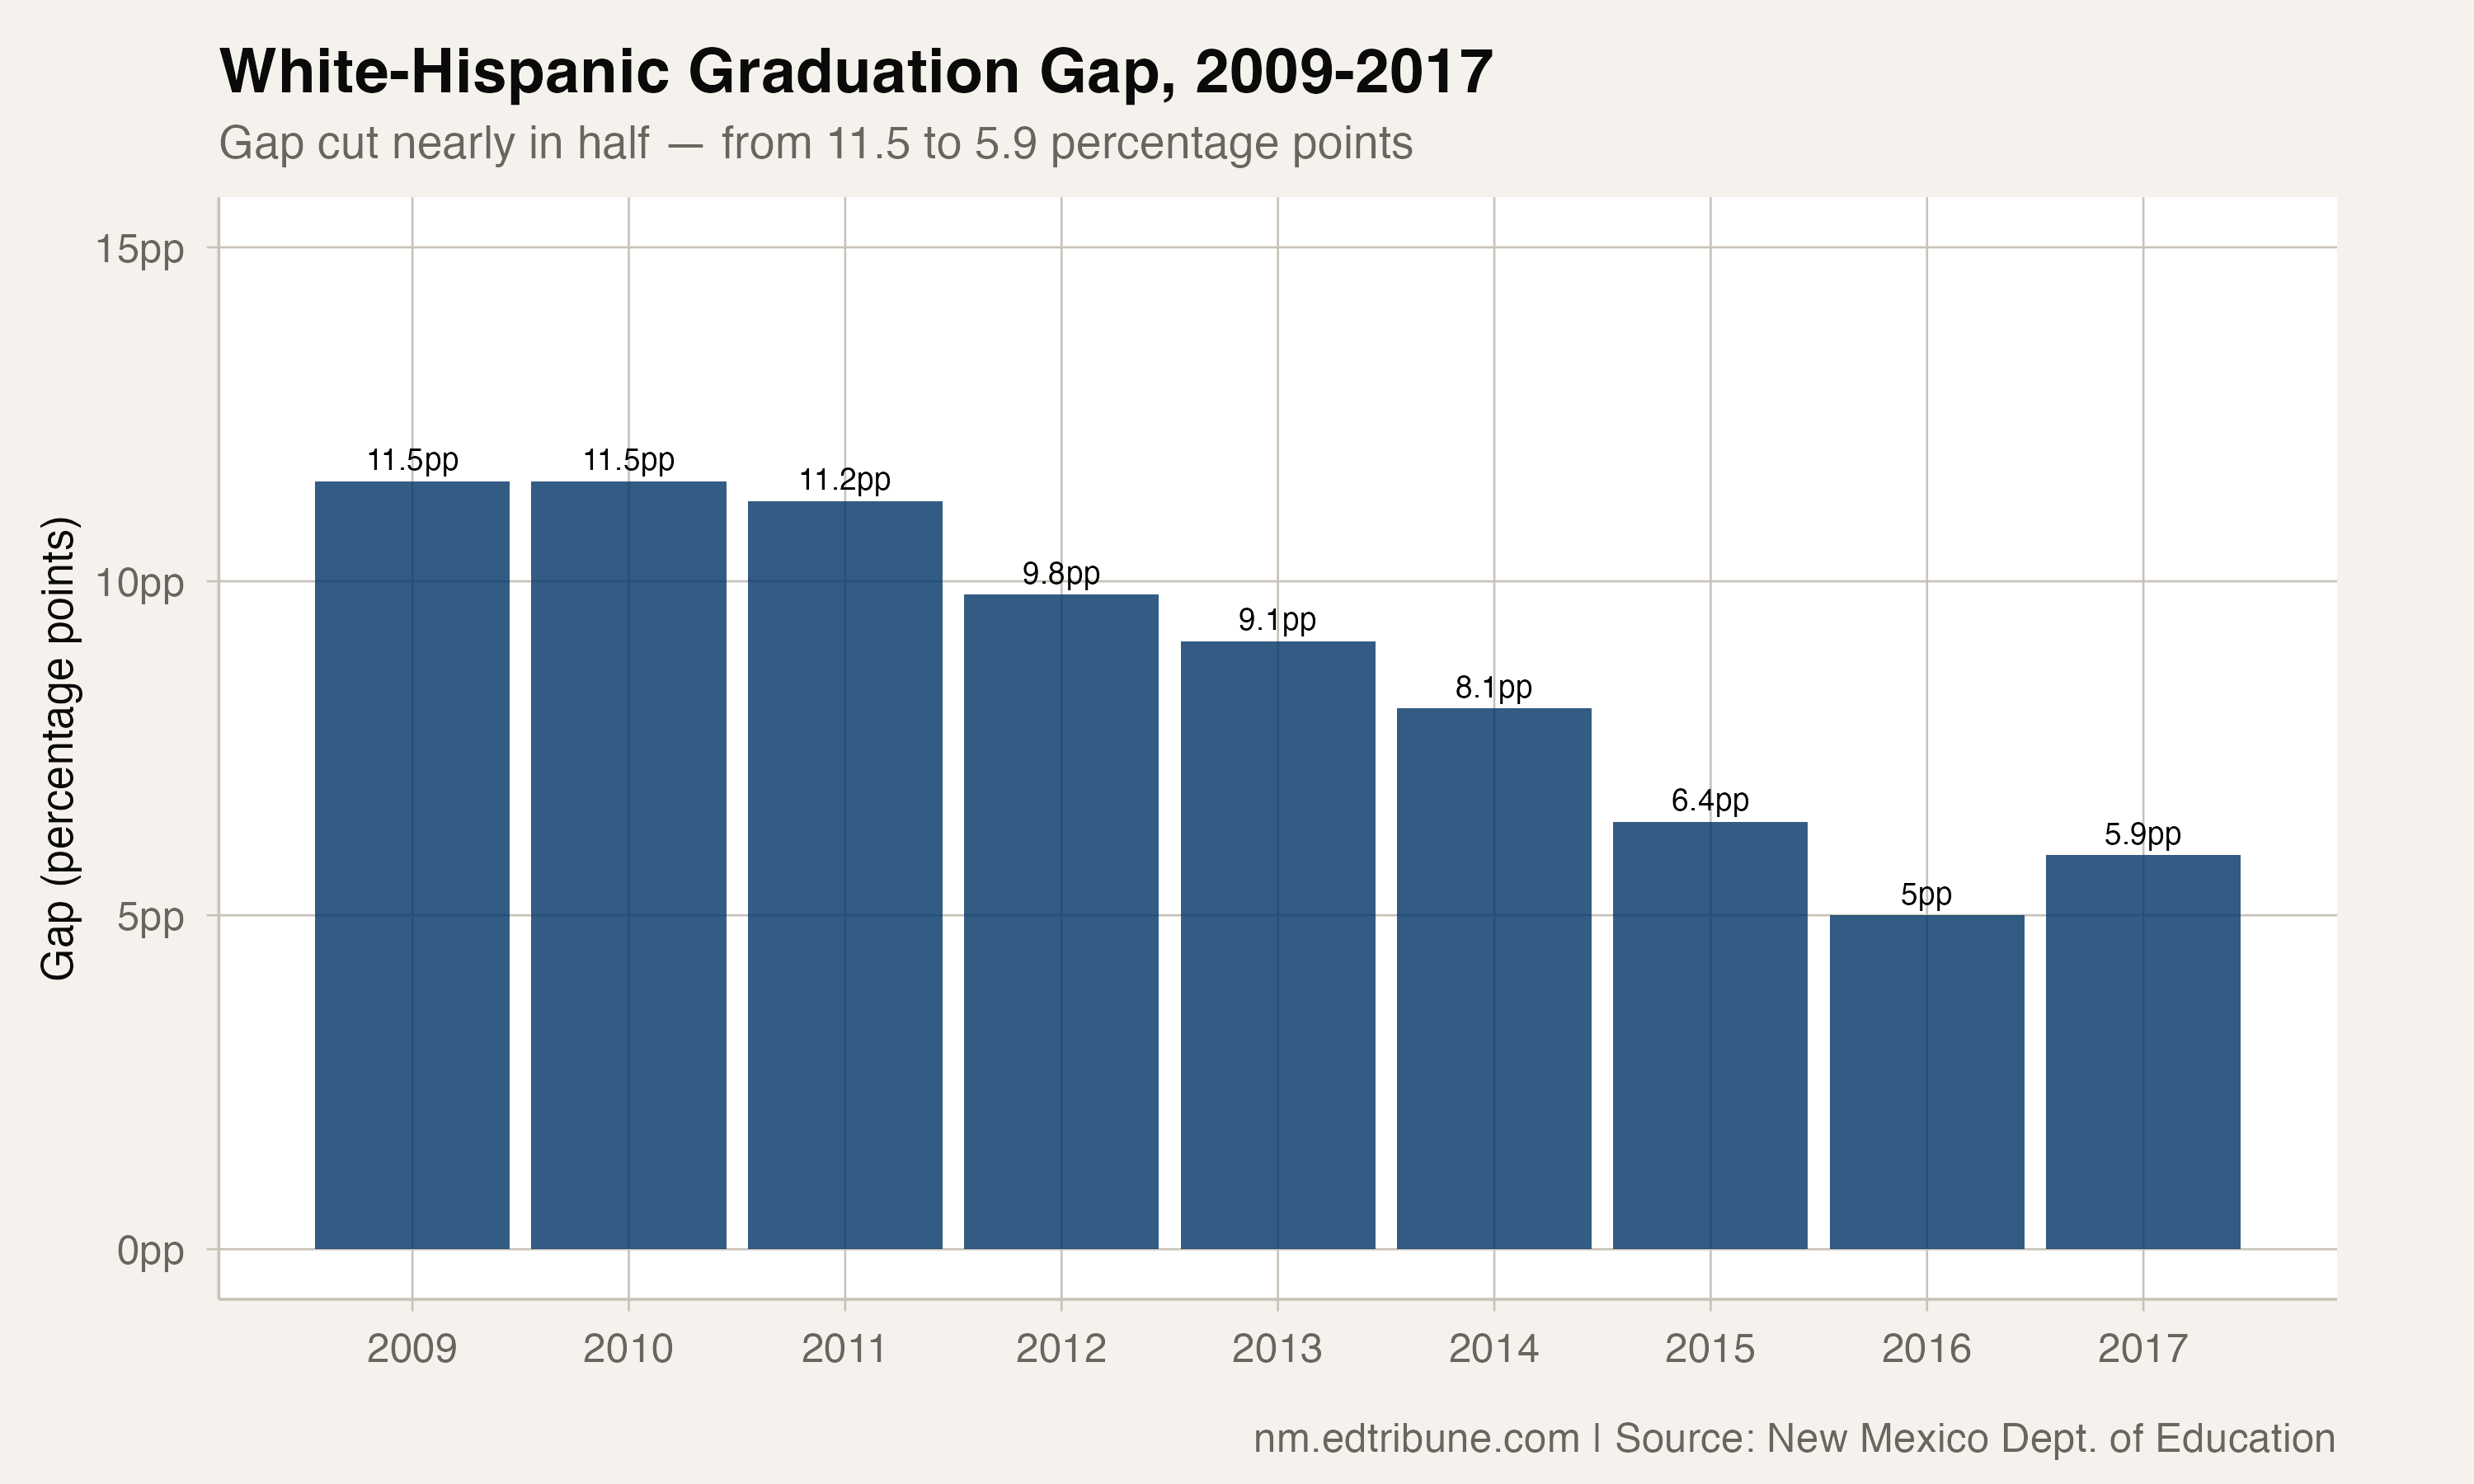
From 2011 to 2016, the gap closed every single year, from 11.2 points to just 5.0 in 2016. The narrowing was driven from both sides during the mid-decade: white rates declined from their 2011-2012 peak of 77.4-77.5% to 73.6% in 2015, while Hispanic rates held relatively steady.
In 2017, the gap ticked back up to 5.9 points as white rates recovered (76.4%) while Hispanic rates dipped slightly from their 2016 peak of 71.0% to 70.5%. Whether this represents a pause or a reversal is impossible to tell from one year of data.
What 70.5% means
The Hispanic graduation rate of 70.5% is an achievement relative to where it started. Its complement is 29.5%, meaning nearly three in ten students in that cohort did not earn a diploma within four years.
The five-year data add another view: Hispanic students gain 4.4 points with an extra year, reaching 75.4% for the 2016 cohort. That was 0.6 point below the 2016 white four-year rate of 76.0%.
The comparison that remains
The in-state gap narrowing is real progress, but the 2017 Hispanic rate remained 5.9 points below the white rate. The available series ends there, so it cannot show whether the gap kept closing after 2017.
Data from the New Mexico Public Education Department. Graduation rates are 4-year Adjusted Cohort Graduation Rates (ACGR) for cohorts 2009-2017.
Detailed code that reproduces the analysis and figures in this article is available exclusively to EdTribune subscribers.
Discussion
Sign in to join the discussion.
Loading comments...