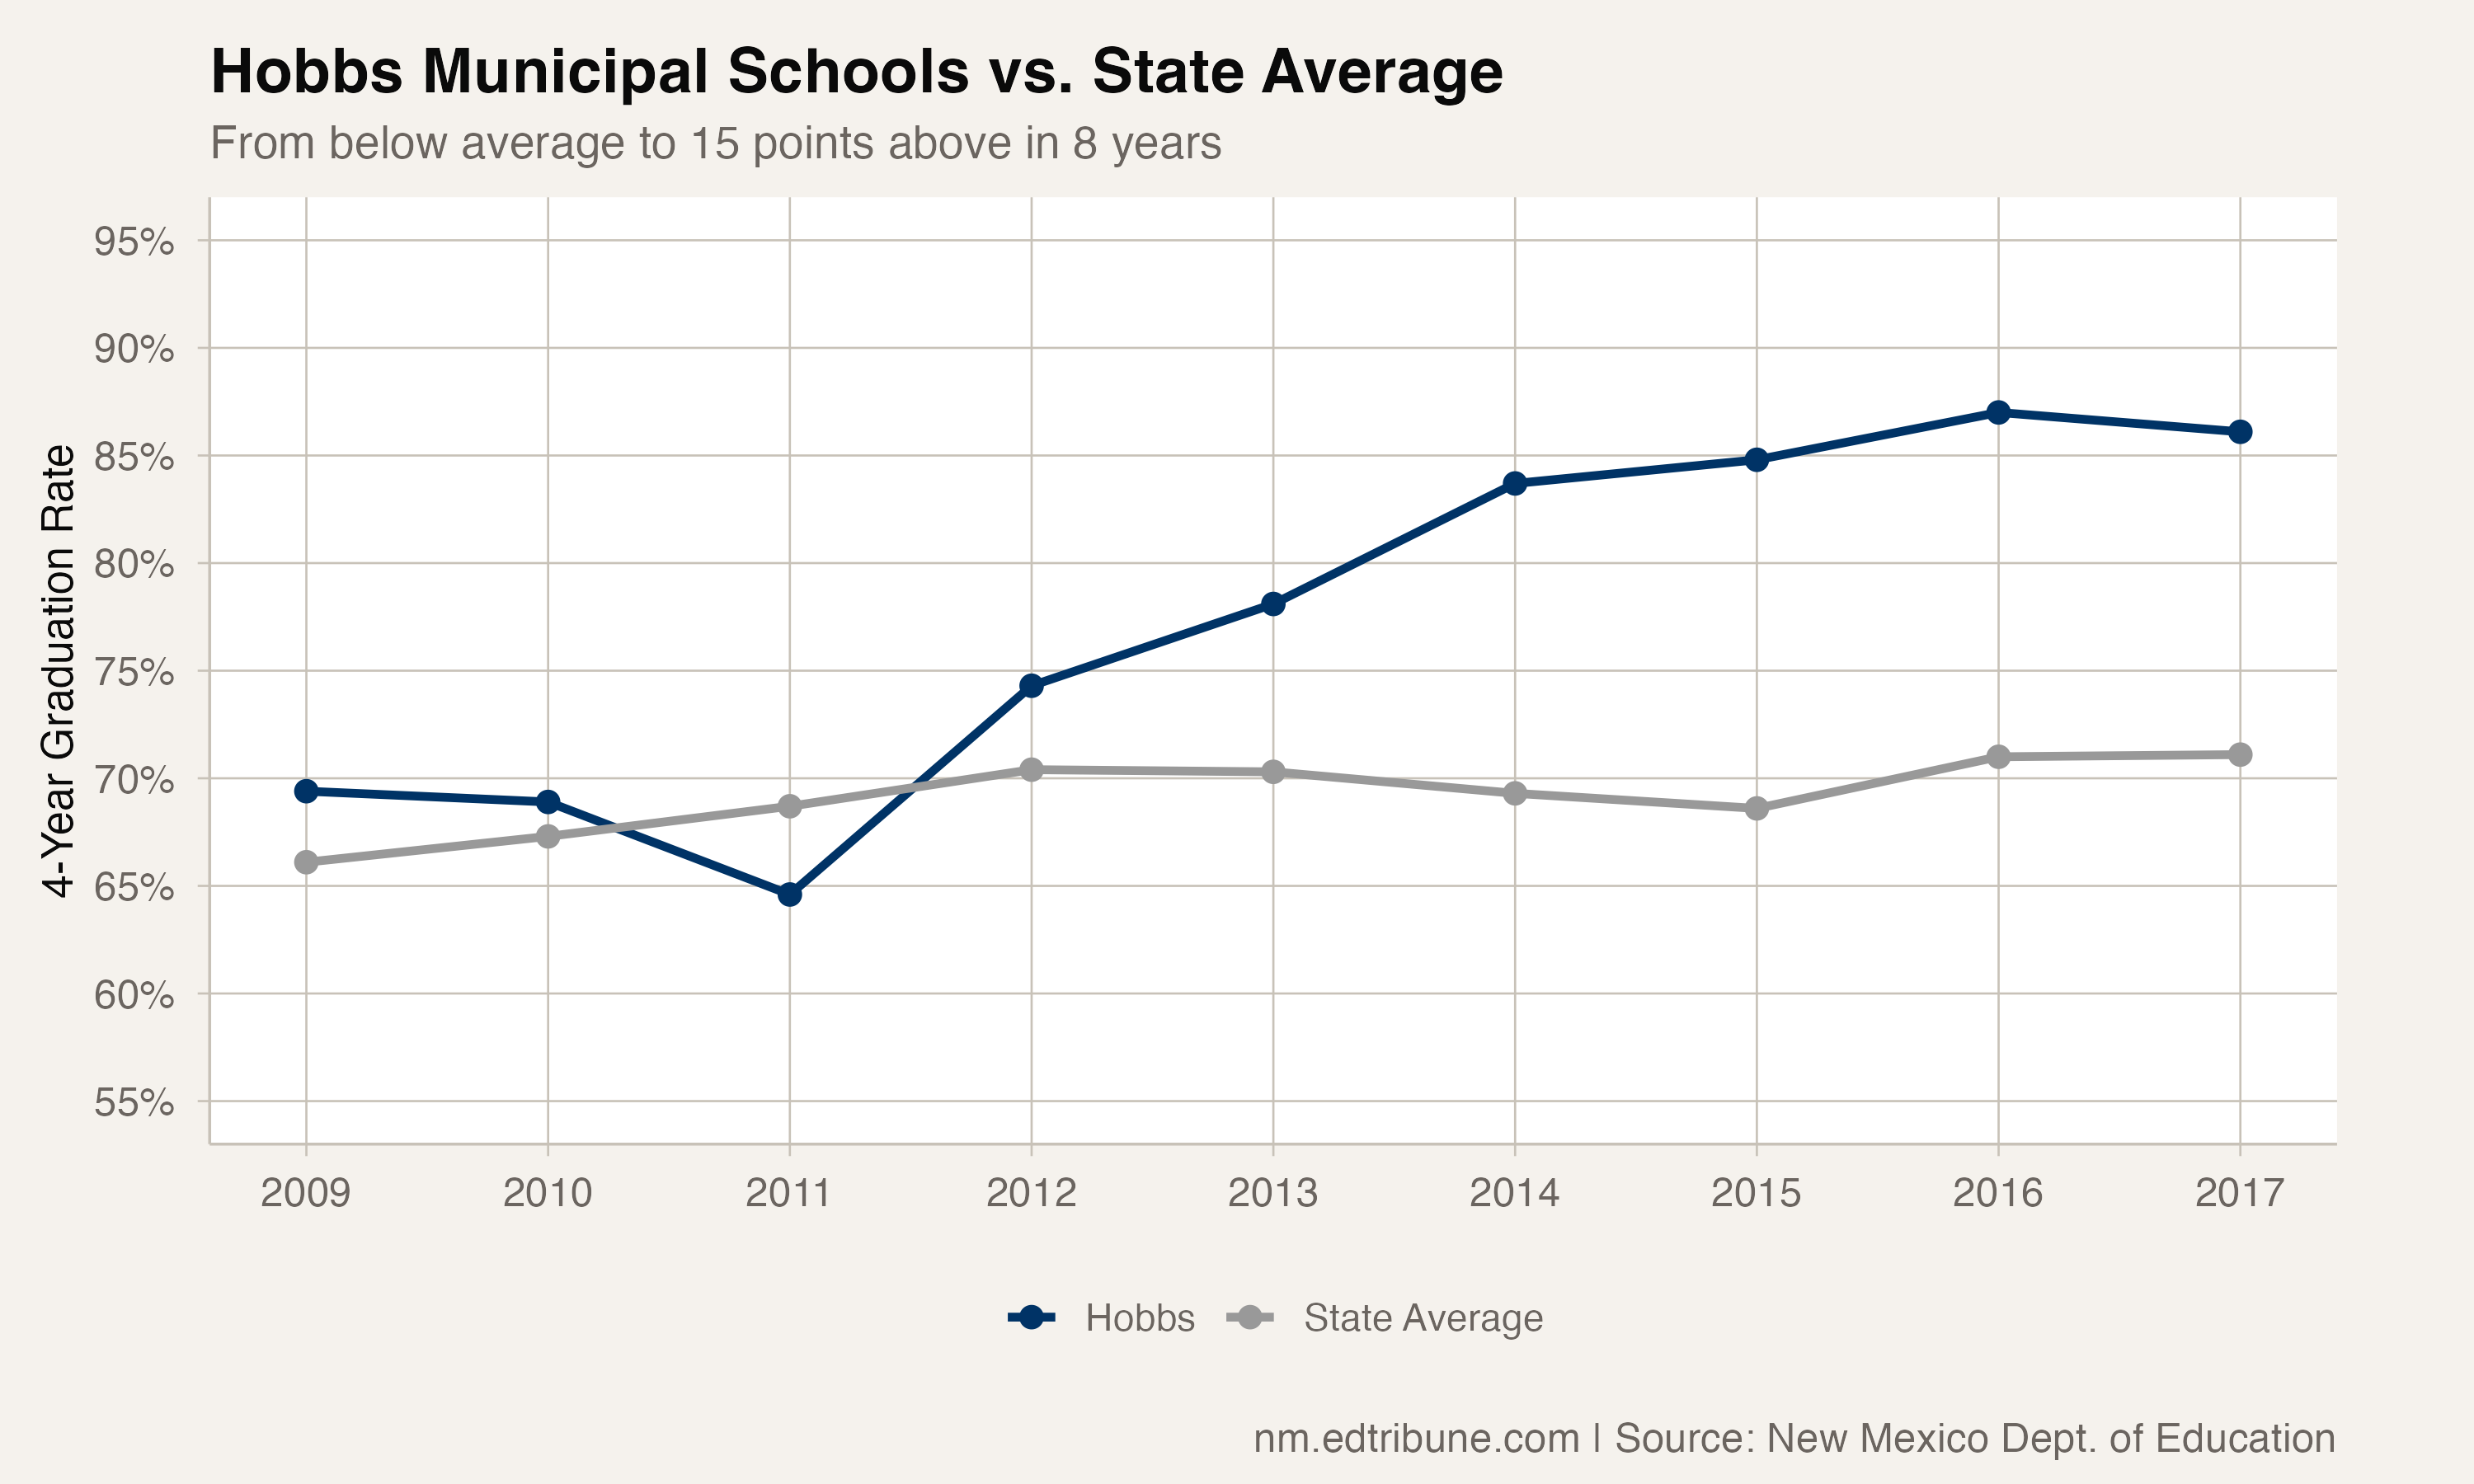
In 2009, Hobbs Municipal Schools↗ET graduated 69.4% of its students on time, three points above the state average but nowhere near the top of the rankings. By 2017, the district was at 86.1%, fifteen points above the state and among the highest-performing mid-size districts in New Mexico.
The 16.7 percentage-point climb over eight years was not incremental. It came in a sustained run of improvement from 2012 to 2016 that added nearly 13 points in just four years.
The trajectory
Hobbs started the ACGR era at 69.4% in 2009, slightly above the state. The rate dipped to 64.6% in 2011 before a turnaround that lasted five consecutive years. From 2012 to 2016, the rate climbed steadily: 74.3%, 78.1%, 83.7%, 84.8%, and 87.0%. In 2017, it dipped slightly to 86.1%, but the district had established itself at a level most New Mexico districts have never reached.
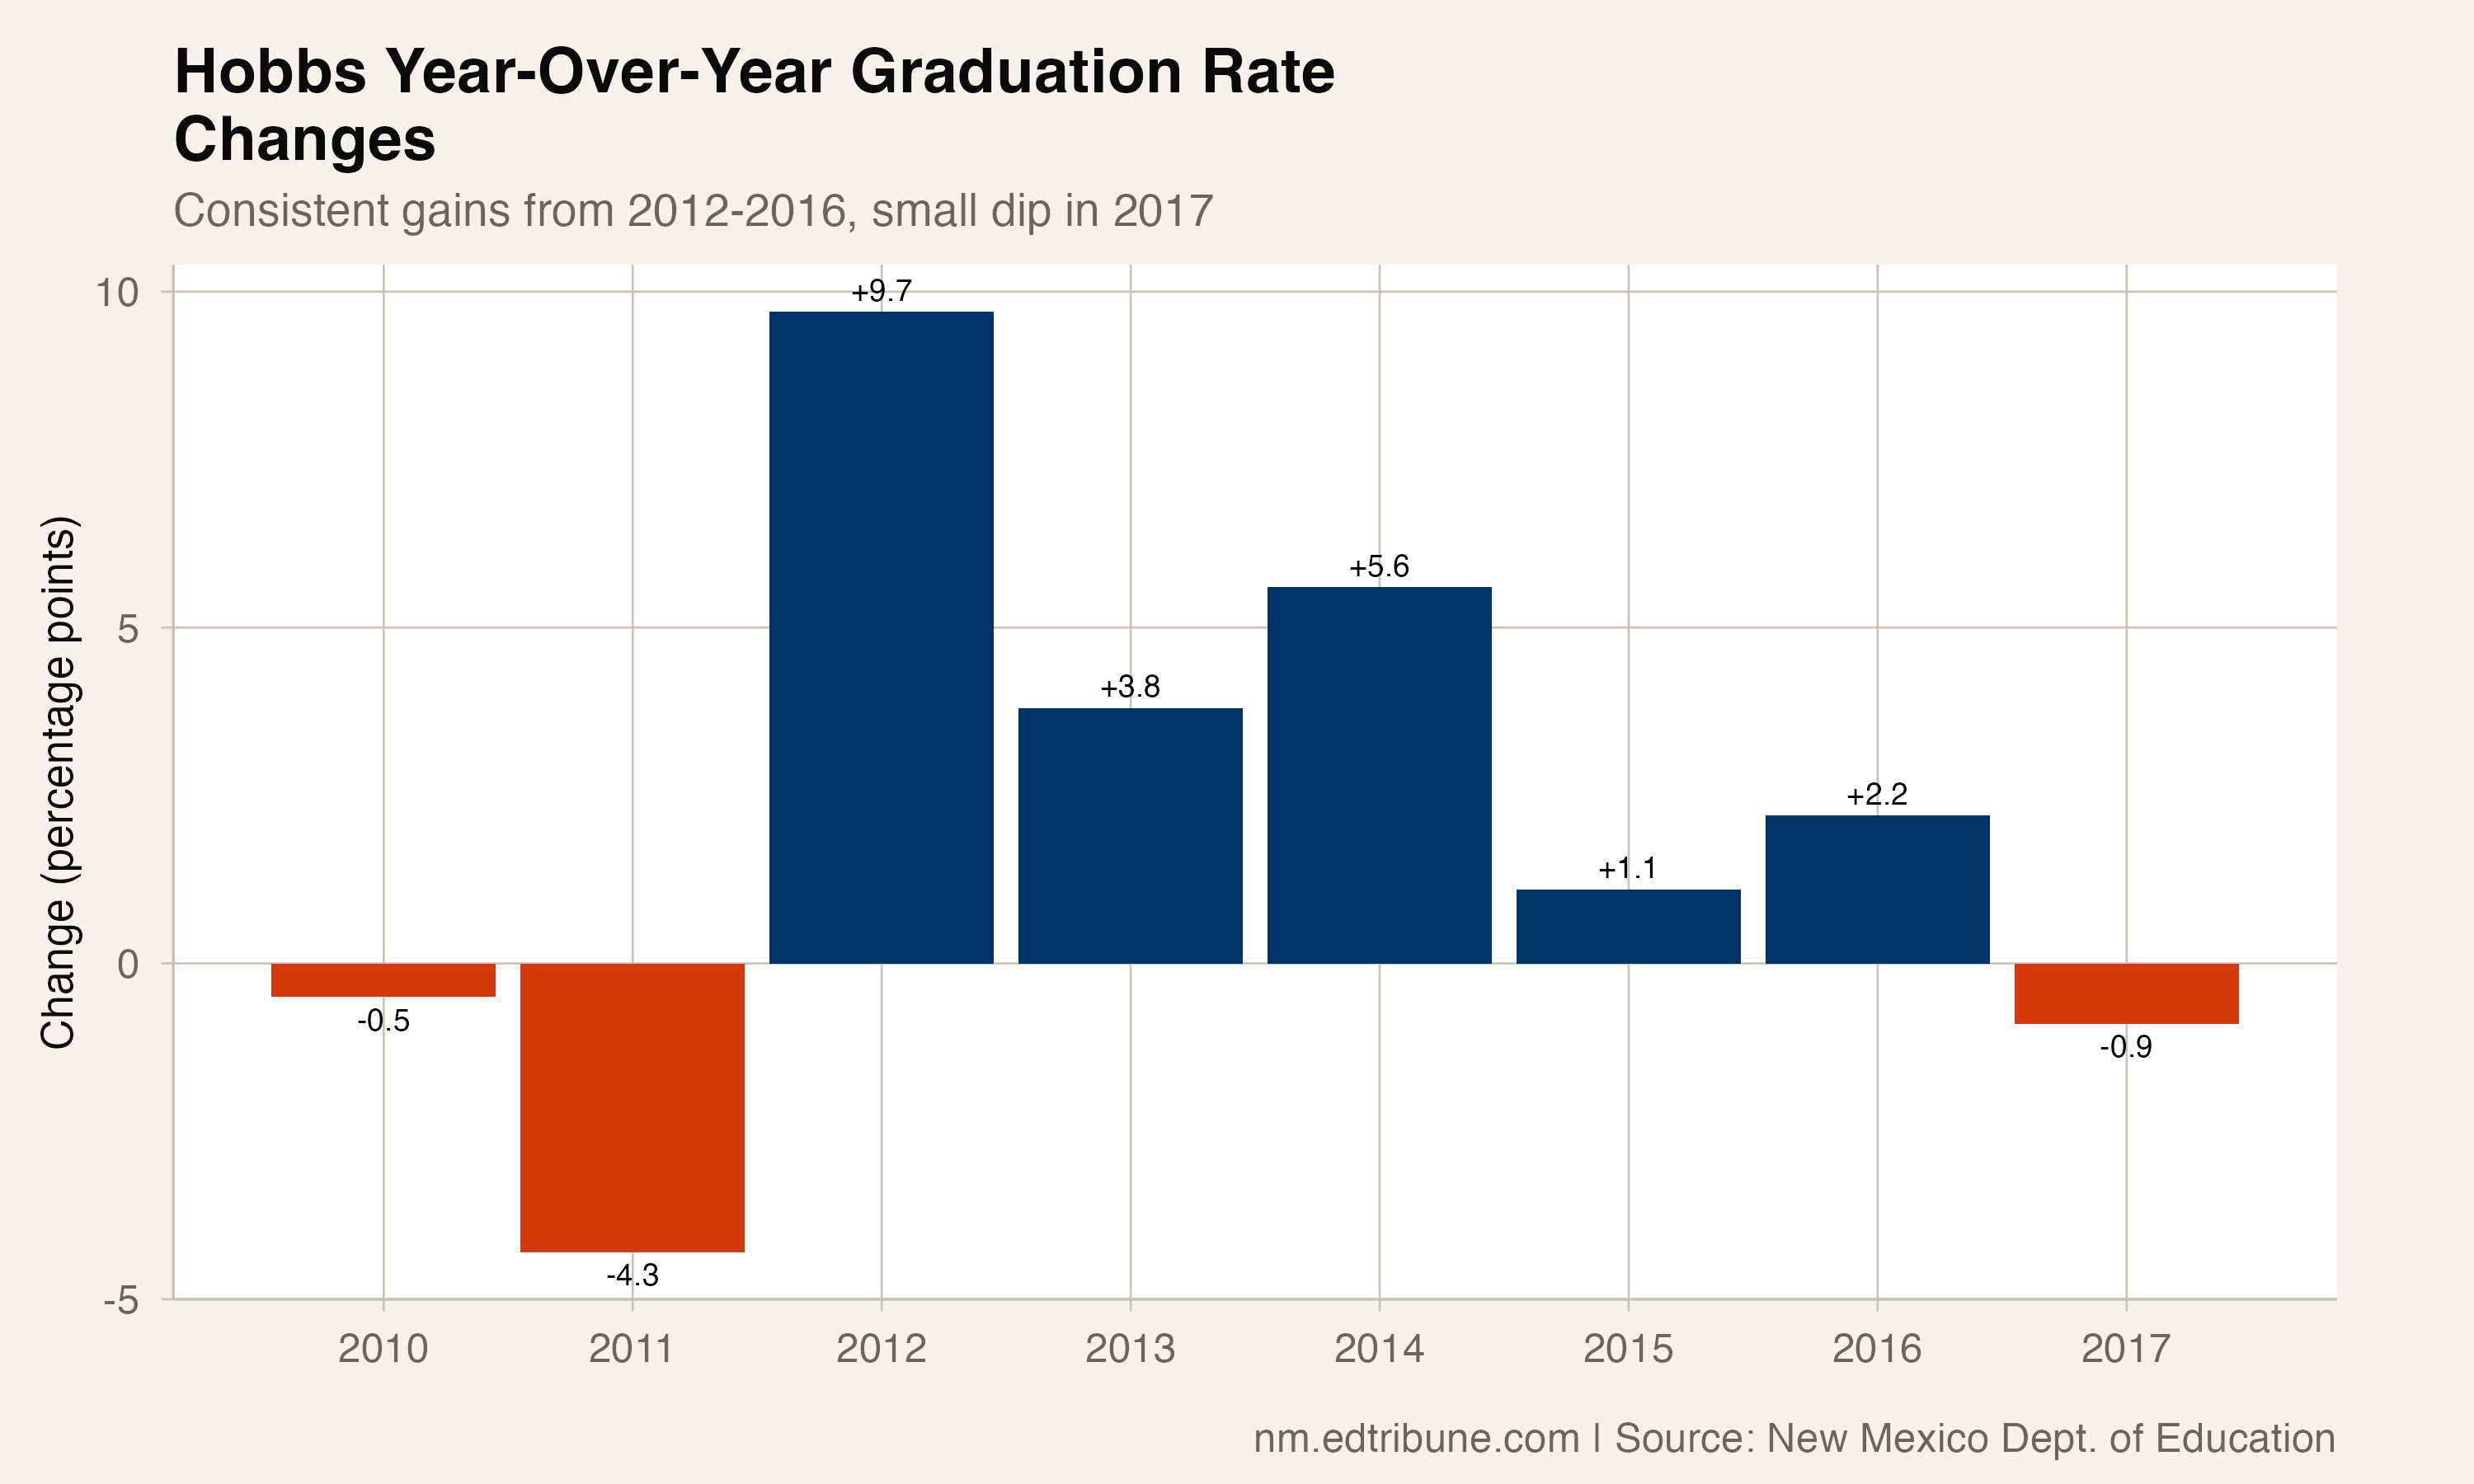
The improvement was not driven by a single year or a statistical blip. Five straight years of gains, ranging from 1.1 to 9.7 points each, suggest structural changes rather than cohort variation.
The equity story
What makes Hobbs' improvement notable is who was graduating. This is not a wealthy suburb where high graduation rates follow from high incomes. Hobbs is a Permian Basin oil town in Lea County, and its student body reflects that economy.
In 2017, students who are economically disadvantaged in Hobbs graduated at 81.8%. Hispanic students, the district's largest demographic group, graduated at 86.0%, nearly identical to the overall rate. Students learning English posted 78.9%. Male students, who statewide graduated at just 67.2%, reached 84.0% in Hobbs.
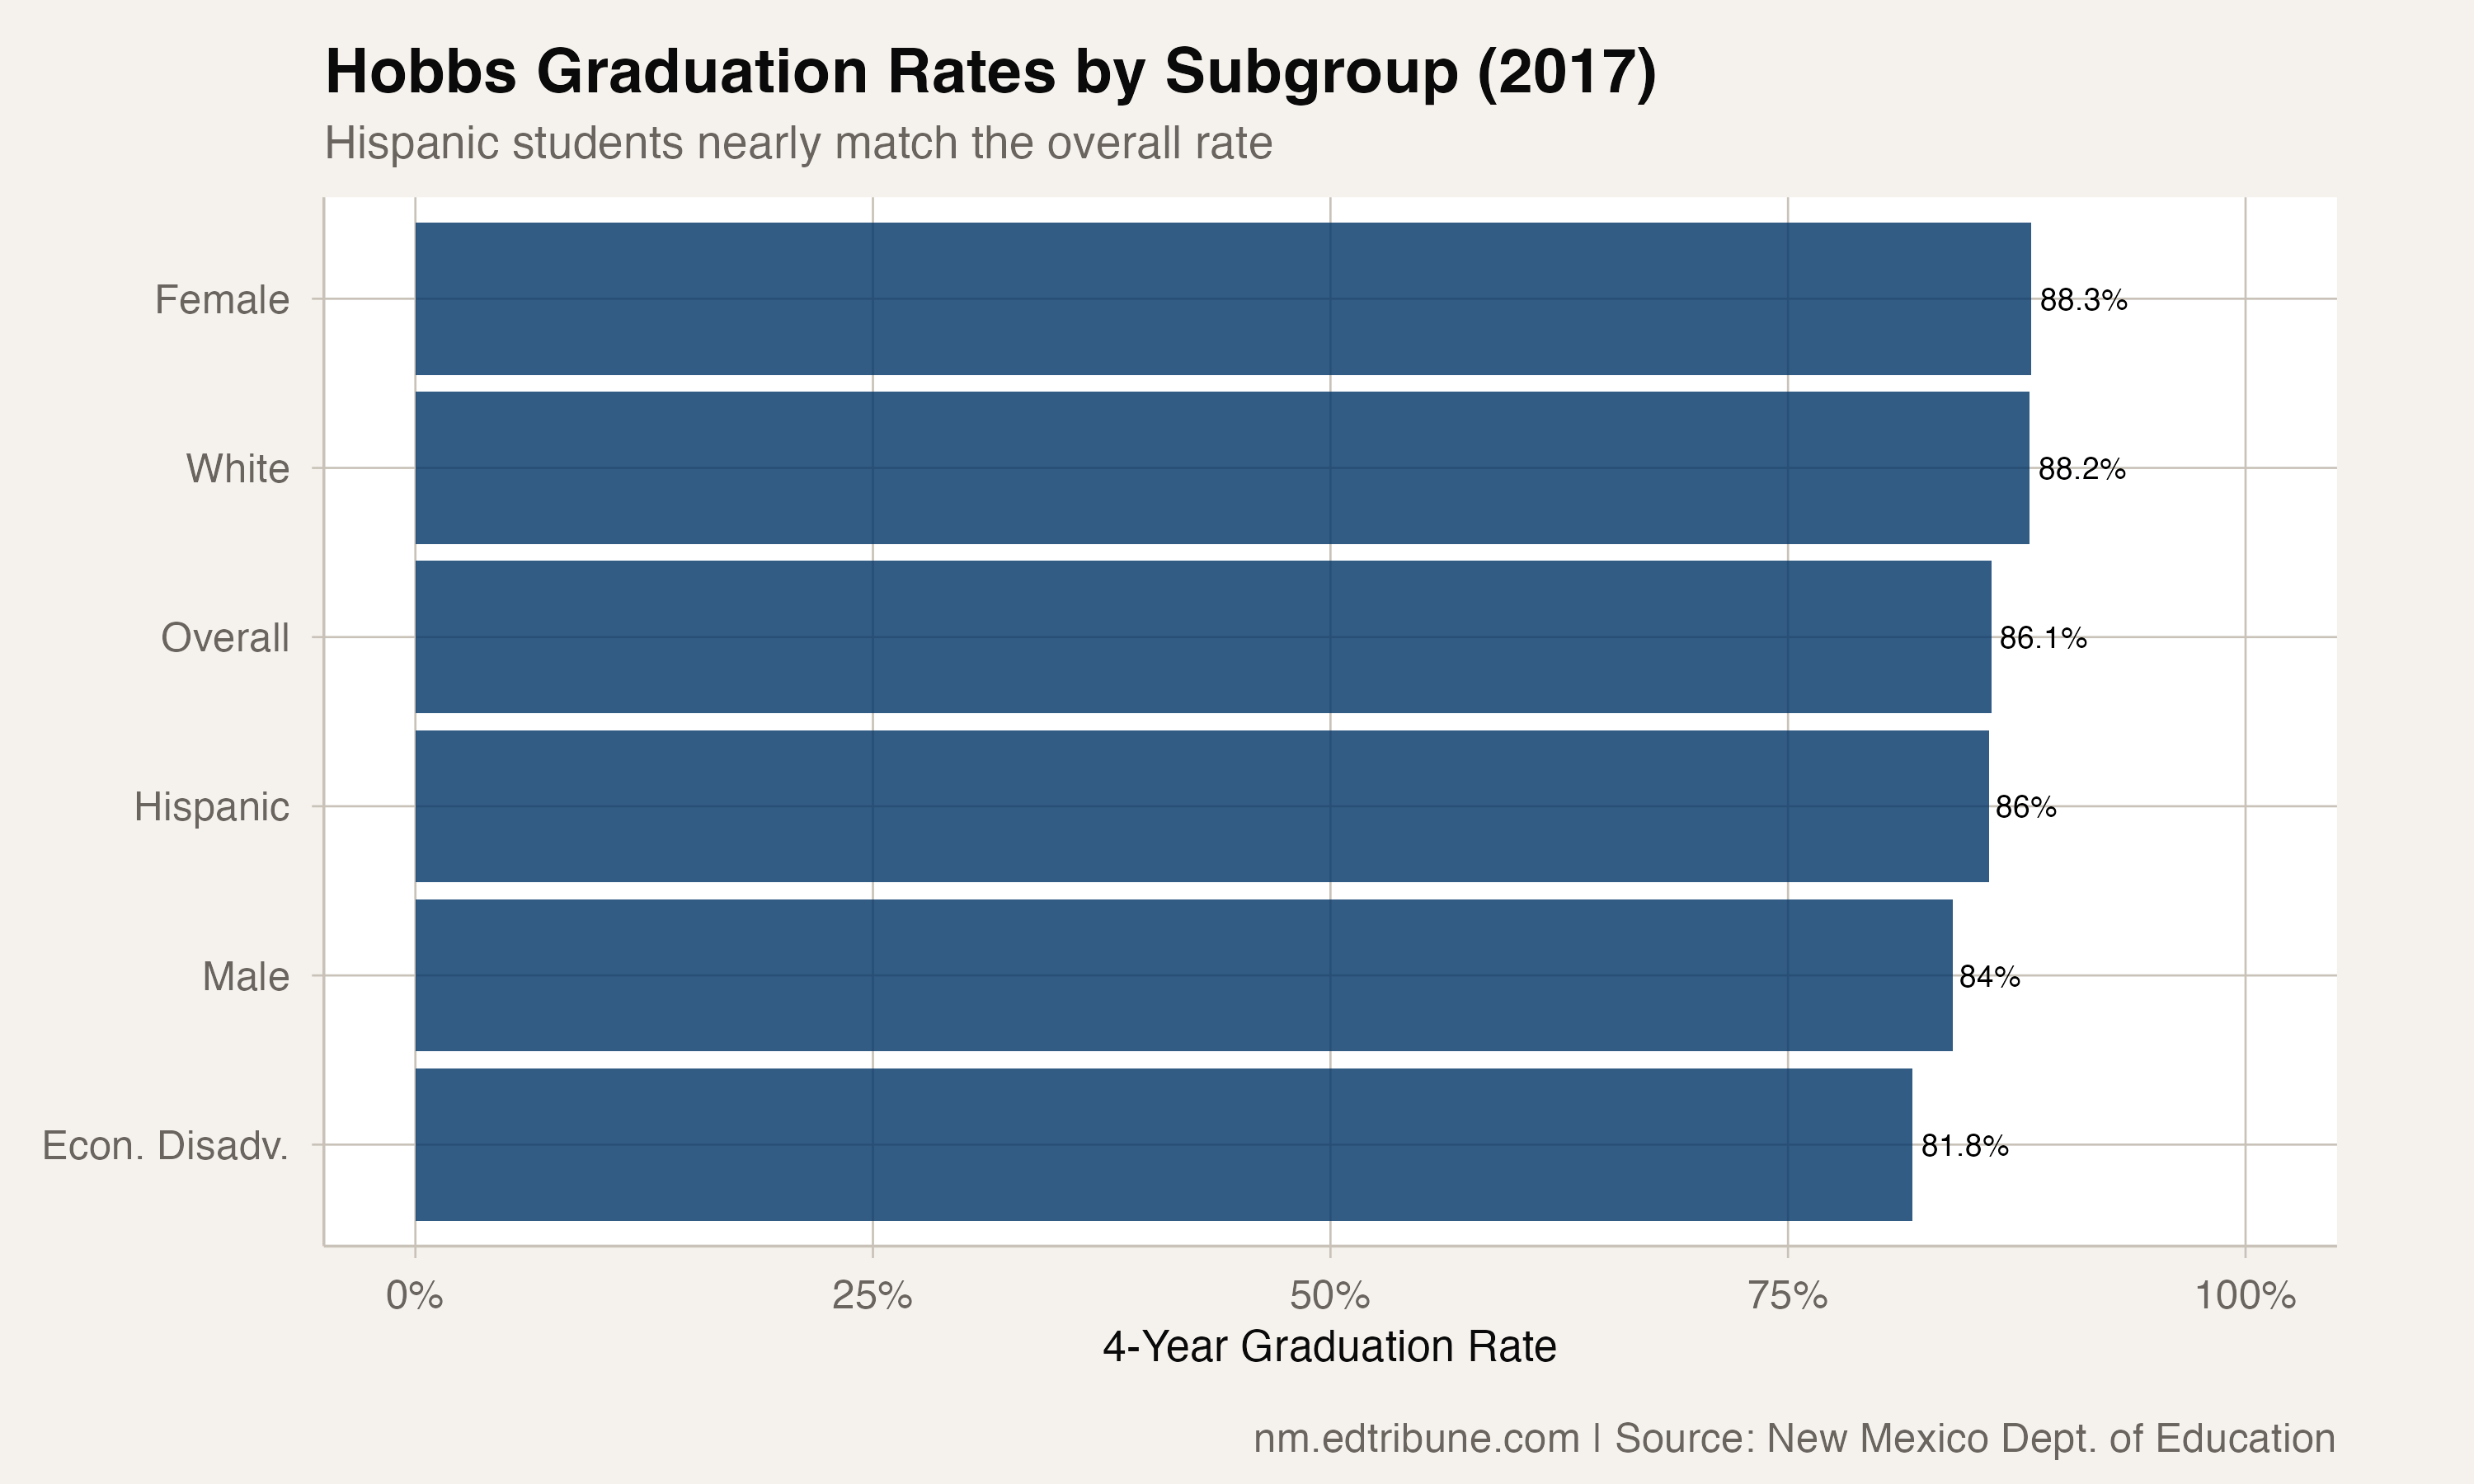
Every major subgroup in Hobbs outperformed the statewide average for that same subgroup by double digits. Hispanic students in Hobbs (86.0%) were 15.5 points above the state Hispanic average (70.5%). Students who are economically disadvantaged (81.8%) were 15.4 points above the state average for that group (66.4%).
Students with disabilities graduated at 72.5%, the lowest subgroup rate in the district but still 11 points above the statewide rate for students with disabilities.
Against the peers
Hobbs did not just outperform the state. It outperformed its geographic and demographic peers in southeastern New Mexico.
Artesia Public Schools, another Lea County district, posted 82.9% in 2017. Lovington Municipal Schools, the Lea County seat, reached 81.0%. Both strong, but neither matched Hobbs.
Further afield, Clovis Municipal Schools came in at 77.9%, Carlsbad Municipal Schools at 69.0%, and Roswell Independent Schools at 65.8%. Roswell, the largest city in the region, graduated students at a rate 20 points below Hobbs.
These are districts with similar economic profiles: oil and gas economies, high poverty rates, significant Hispanic populations. The variance in outcomes across them makes the case that district-level decisions matter more than regional economics alone.
The unanswered question
The numbers show what happened but not why. Hobbs' improvement coincided with the Permian Basin oil boom that brought an influx of families and investment to the region. Whether the boom helped graduation rates, through increased local tax revenue or a tighter job market that kept families stable, is a question the data cannot answer.
The 2011 dip to 64.6% preceded the improvement streak and may have been a catalyst. Districts sometimes reform graduation tracking and support systems after a low year. Whether Hobbs implemented specific interventions, such as credit recovery programs, attendance initiatives, or graduation coaches, would require reporting beyond what the state data provides.
Hobbs' 86.1% rate in 2017 matched the national average. The state as a whole sat 16 points below it. Whatever this Permian Basin district did differently, and the data alone cannot say what, it produced outcomes that most of New Mexico has never approached.
Data from the New Mexico Public Education Department. Graduation rates are 4-year Adjusted Cohort Graduation Rates (ACGR) for cohorts 2009-2017.
Detailed code that reproduces the analysis and figures in this article is available exclusively to EdTribune subscribers.
Discussion
Sign in to join the discussion.
Loading comments...