New Mexico added 7,779 students to its special education rolls since 2019. In the same period, overall enrollment fell by 36,778. The result: one in five students in the state now receives special education services, a rate that exceeds the national average by more than five percentage points.
The 20.5% special education rate in 2025-26 is not just a milestone. It represents a structural shift in who New Mexico schools are serving and what those schools need to function. The state has crossed a threshold that only a handful of states have reached, and it did so while losing students, closing schools, and struggling to fill nearly 300 special education teaching vacancies.
The numbers behind the threshold
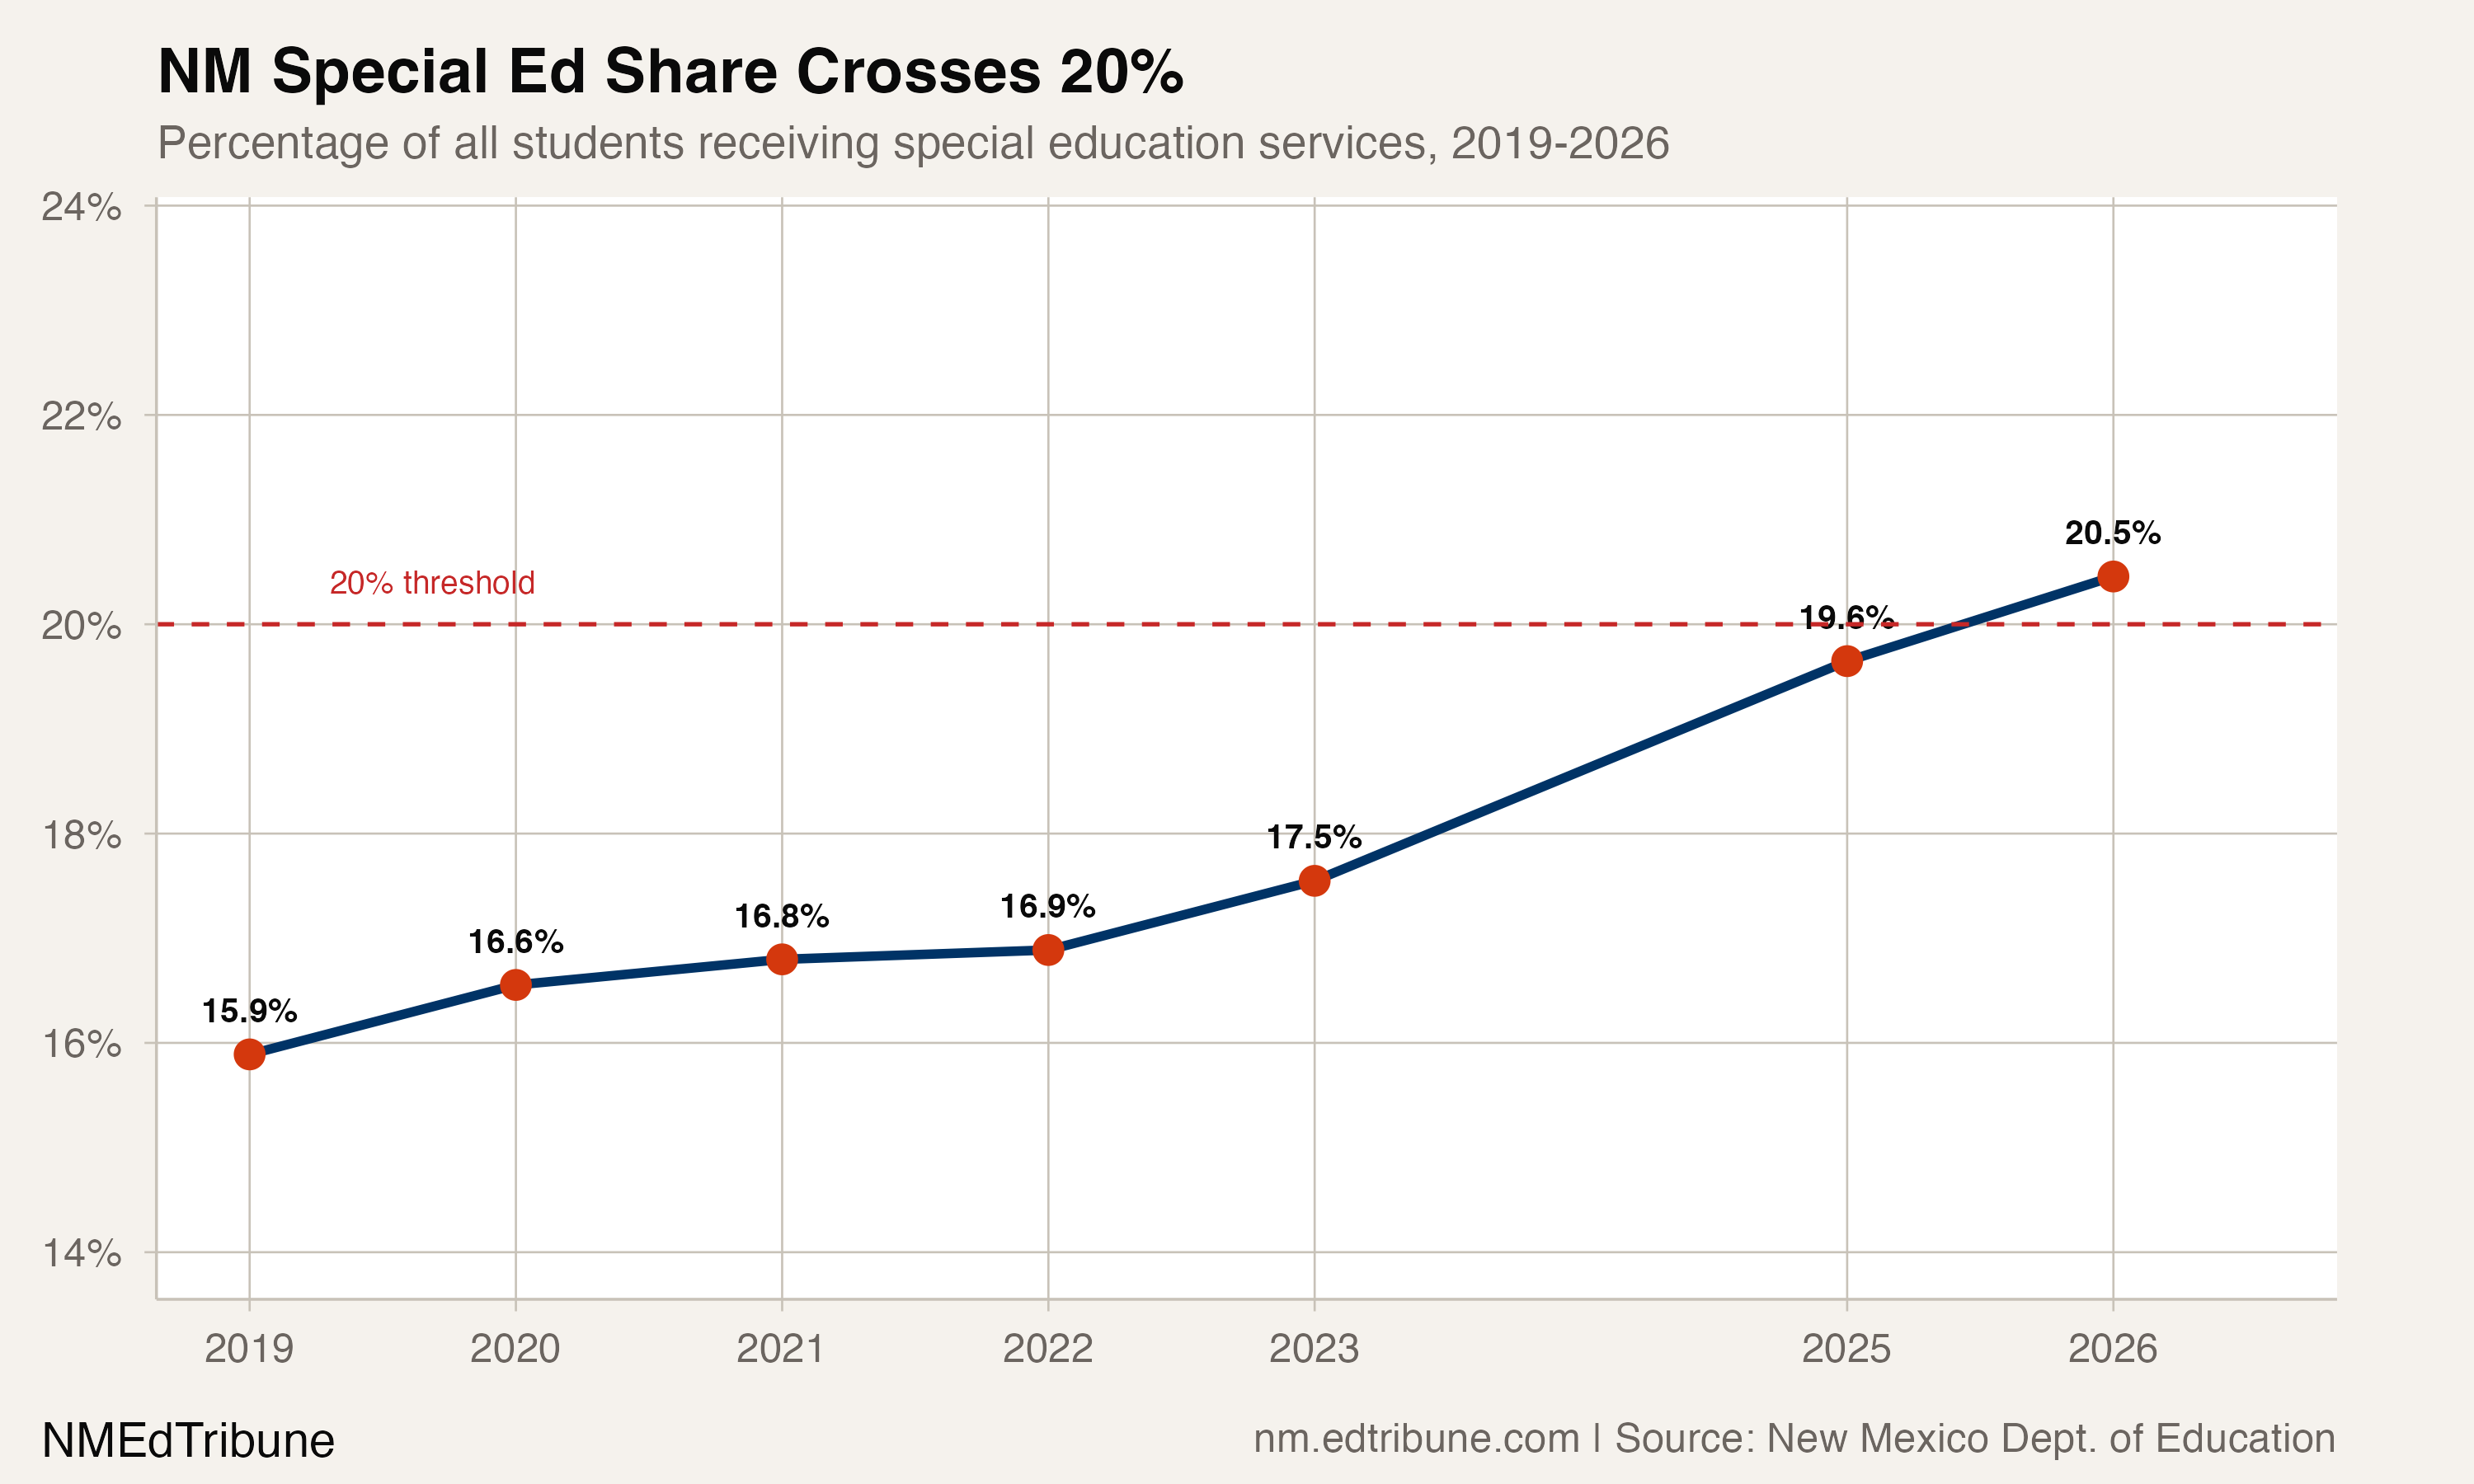
In 2018-19, 53,253 students received special education services, 15.9% of the total. By 2025-26, that count rose to 61,032 while the denominator shrank from 335,131 to 298,353. Both movements pushed the rate upward: more students identified, fewer students enrolled overall.
The increase was not steady. After a pandemic dip in 2020-21 (down 1,593 students, likely reflecting disrupted evaluations), the count recovered and then surged. The largest single-year jump came in 2023-24 (+2,582), followed by another large gain in 2024-25 (+2,138). Across those two years, the special education count rose by 4,720 students (8.5%).
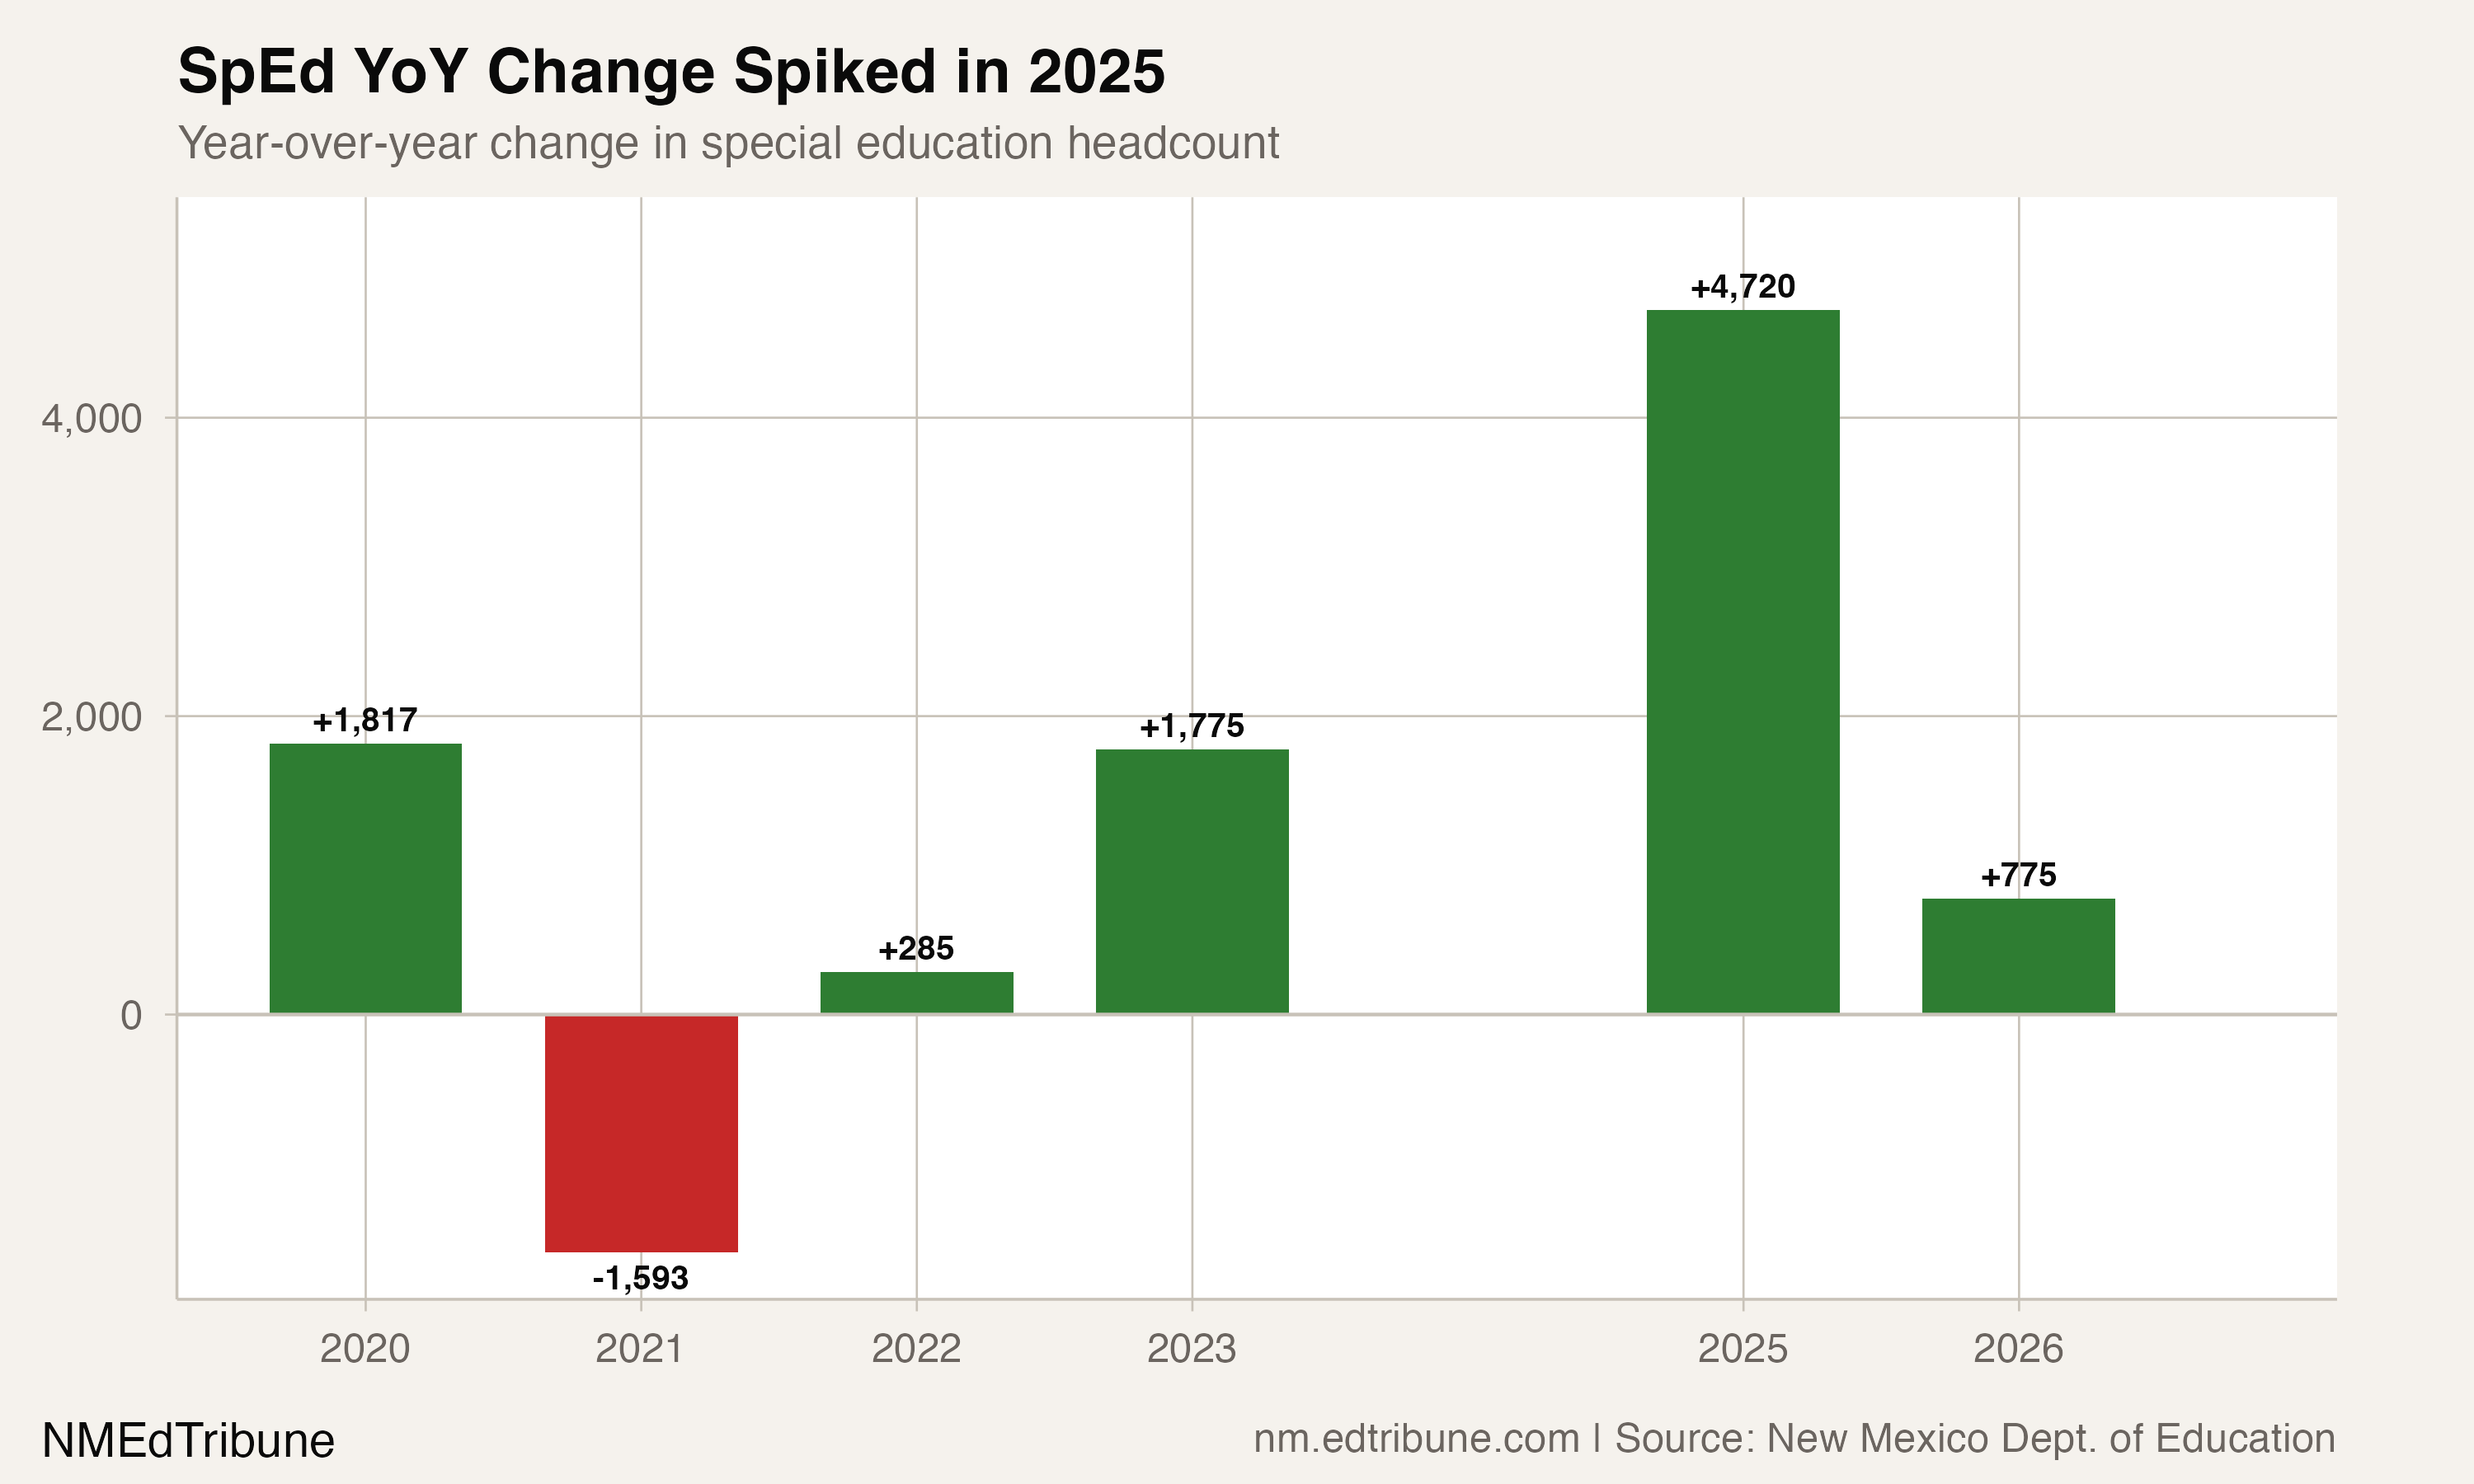
That 2023-24 to 2024-25 surge deserves scrutiny. The newly available 2023-24 subgroup snapshot shows the growth was distributed across two consecutive years, not compressed into a single reporting interval.
A scissor graph: more IEPs, fewer students
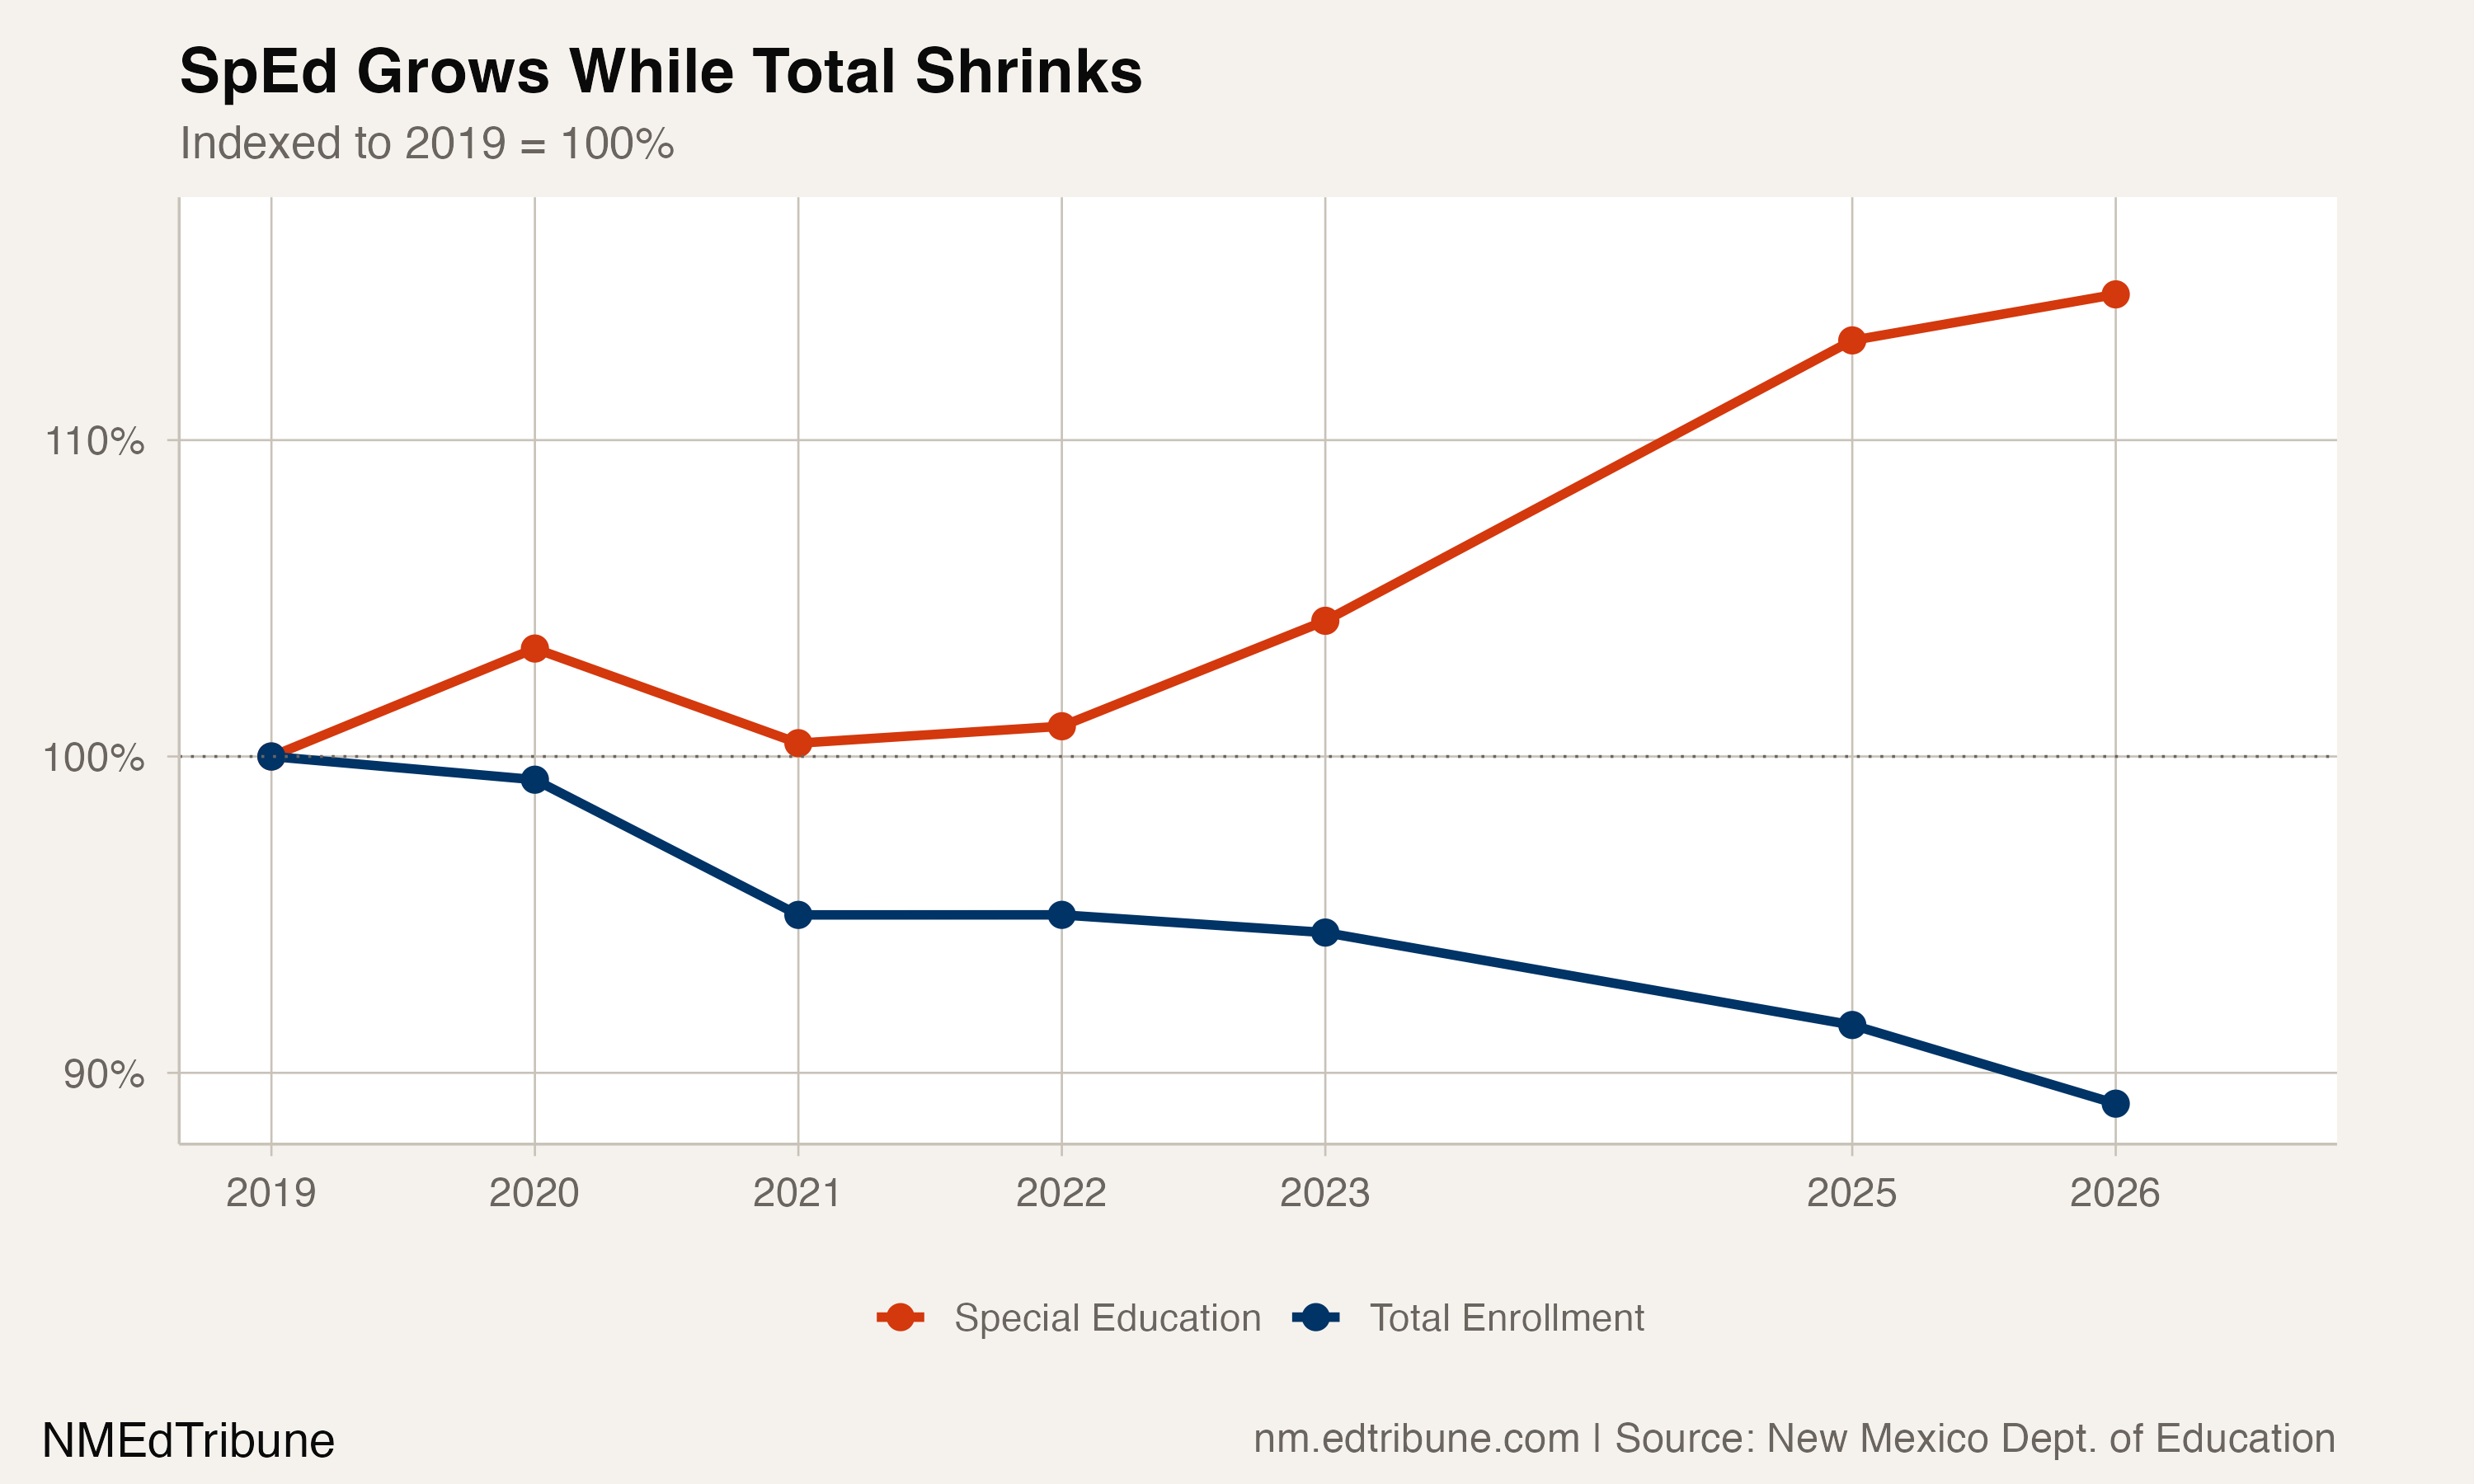
Indexed to 2019, total enrollment has fallen to 89% of its starting point. Special education enrollment has risen to 115%. The gap between the two lines widened in every period except 2020-21, when pandemic disruptions temporarily suppressed both identification and enrollment.
This divergence creates a compounding fiscal problem. New Mexico's public education funding formula weights special education students at higher multipliers to reflect the cost of Individualized Education Programs, specialized staffing, and related services. As the share of students entitled to those services grows while the base enrollment generating foundation funding shrinks, districts face a structural mismatch: rising per-pupil service obligations against a declining revenue base.
Where the rate is highest
Fifty-three of the state's 152 districts with special education data now have rates above 20%. That is 34.9% of all districts, up from a far smaller share in 2019. Among the 137 districts with data in both years, 118 (86.1%) saw their special education rate increase. The median increase was 4.1 percentage points.
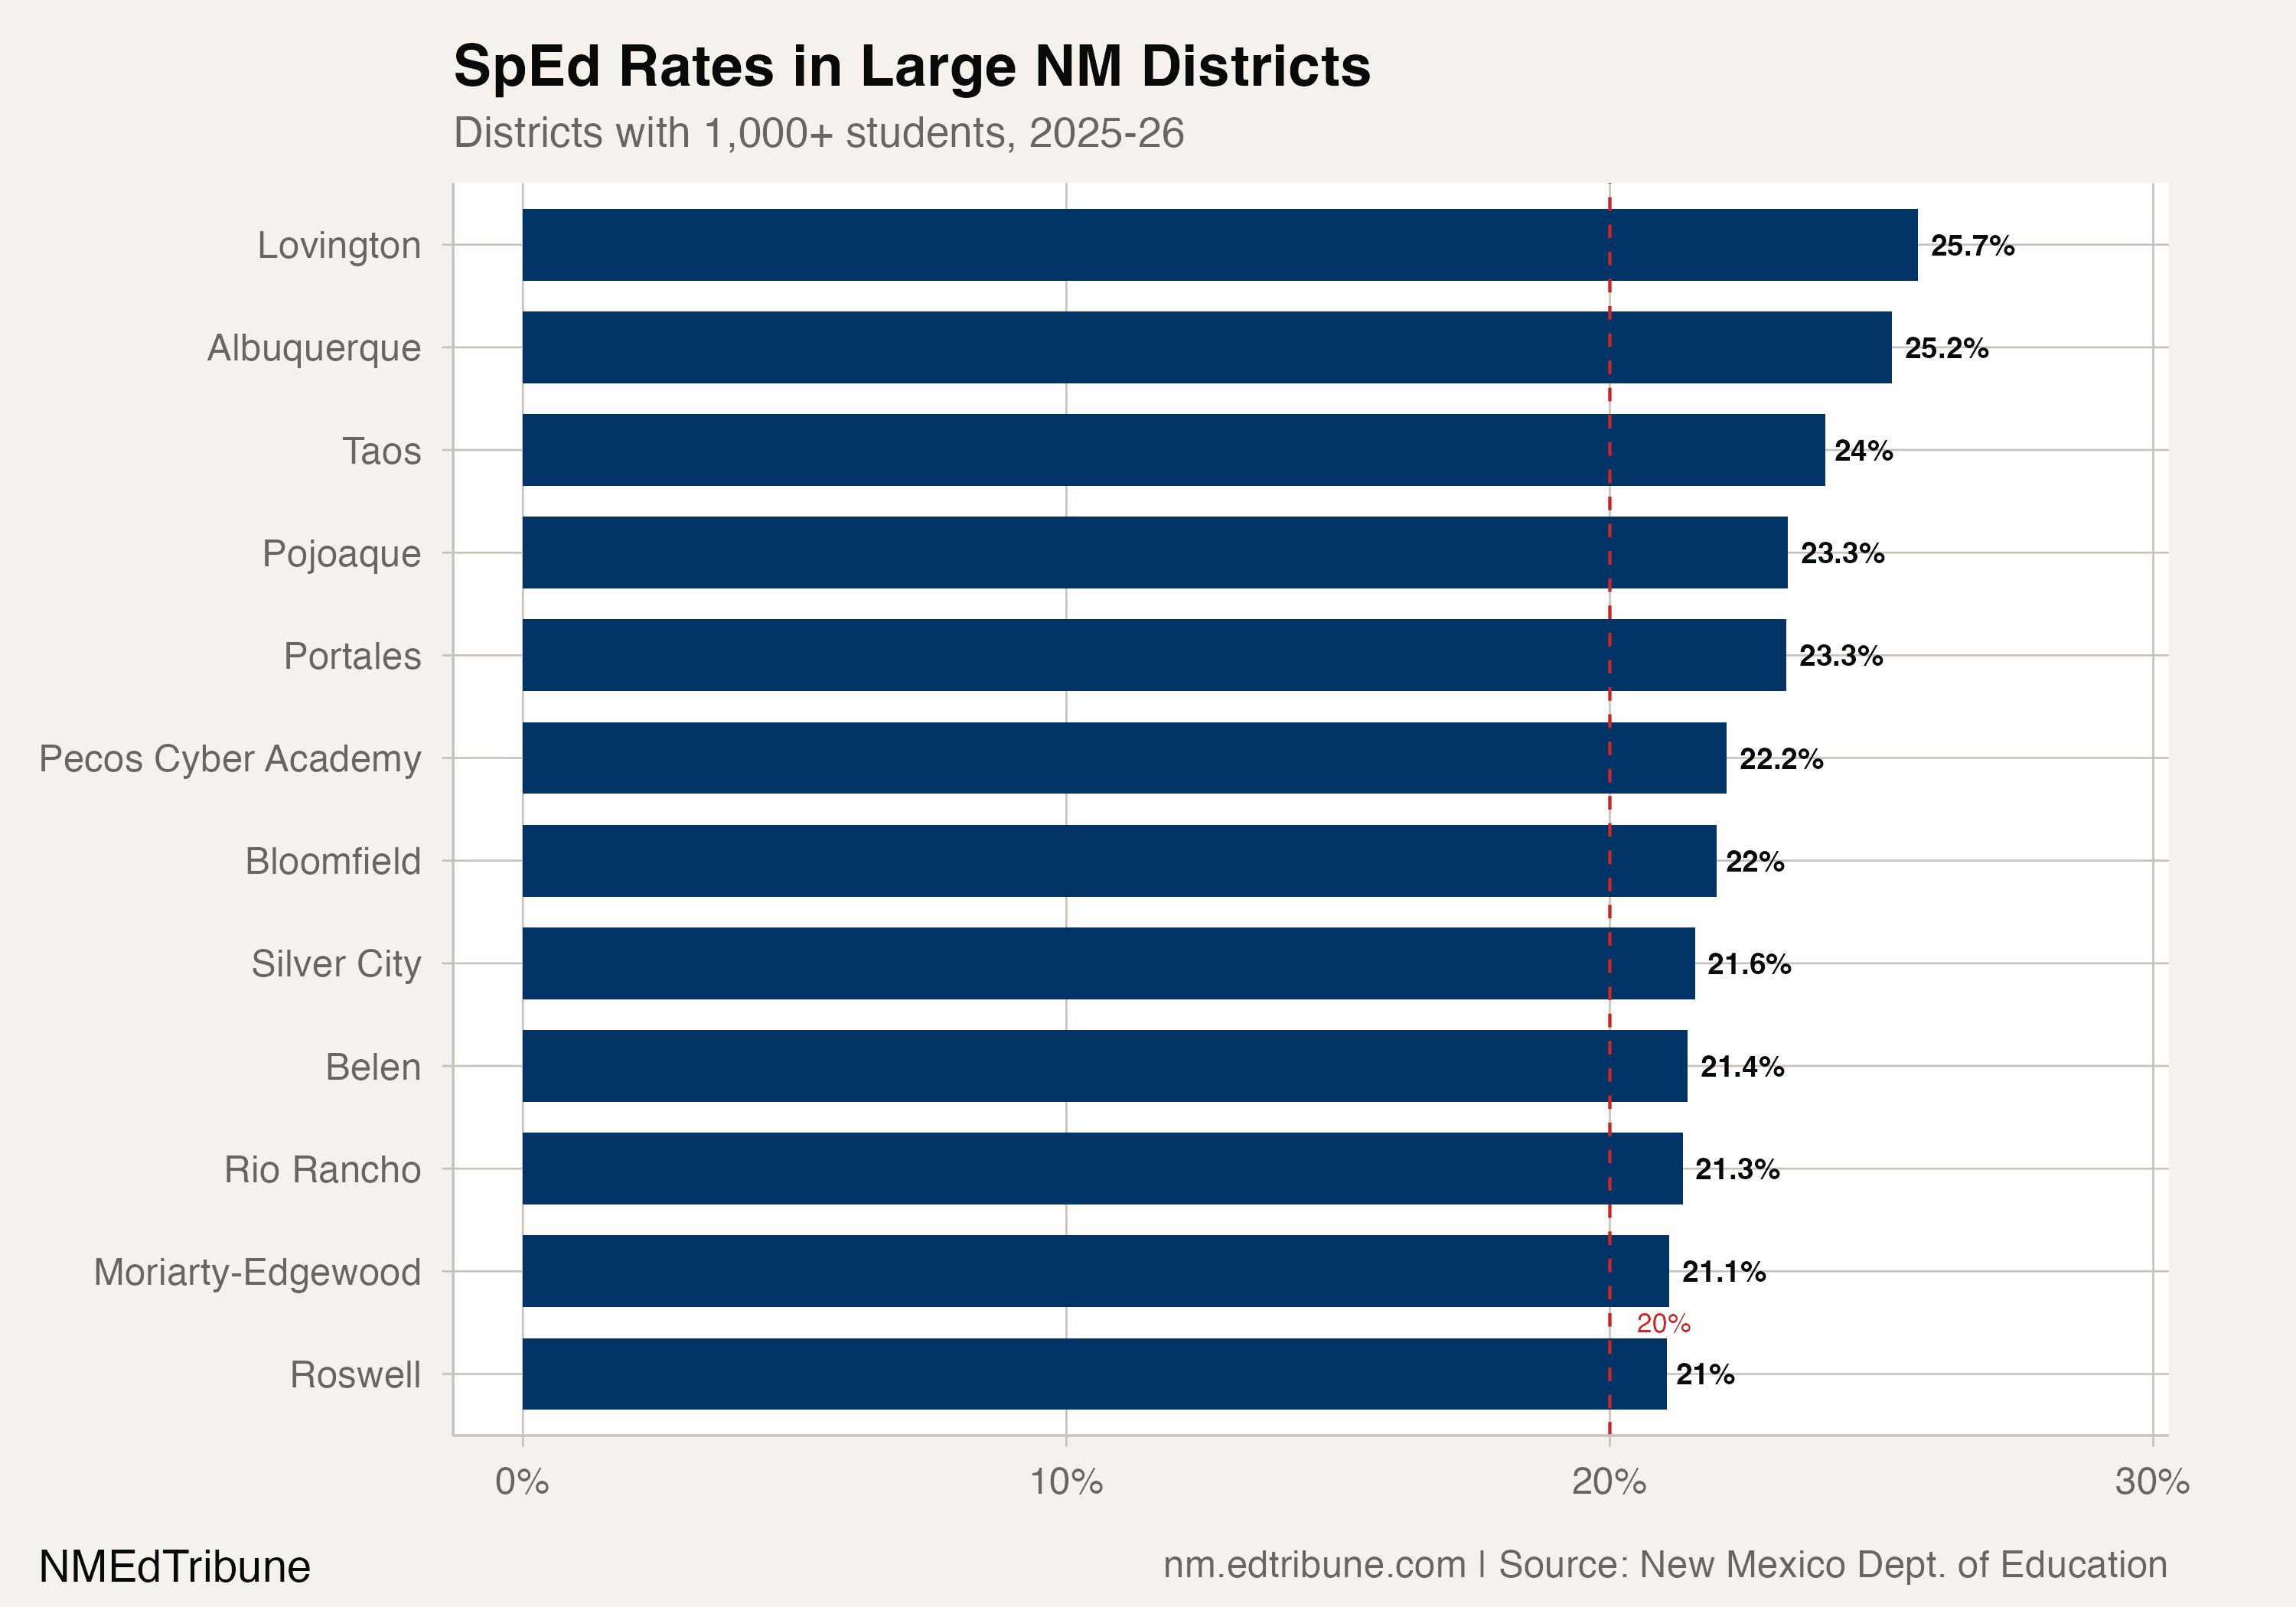
Albuquerque↗ET stands out. The state's largest district now has a 25.2% special education rate, up from 17.7% in 2019, a 7.5 percentage-point jump. One in four APS students has an IEP. With 18,282 students receiving services, Albuquerque alone accounts for 30.0% of the state's entire special education population. The district's total enrollment has fallen from 90,240 to 72,573 over the same period, but its special education count grew by 2,319.
Rio Rancho↗ET crossed 20% in 2024-25 and now sits at 21.3%, with 3,467 students. Las Cruces↗ET, the state's second-largest district, has not yet crossed the threshold but is approaching it at 19.2%, up from 15.1%.
Smaller districts show even more extreme rates. Lovington, at 25.7%, leads among districts with at least 1,000 students. Several small districts and charters exceed 25%, though small denominators make those rates volatile.
Special ed overtakes English learners
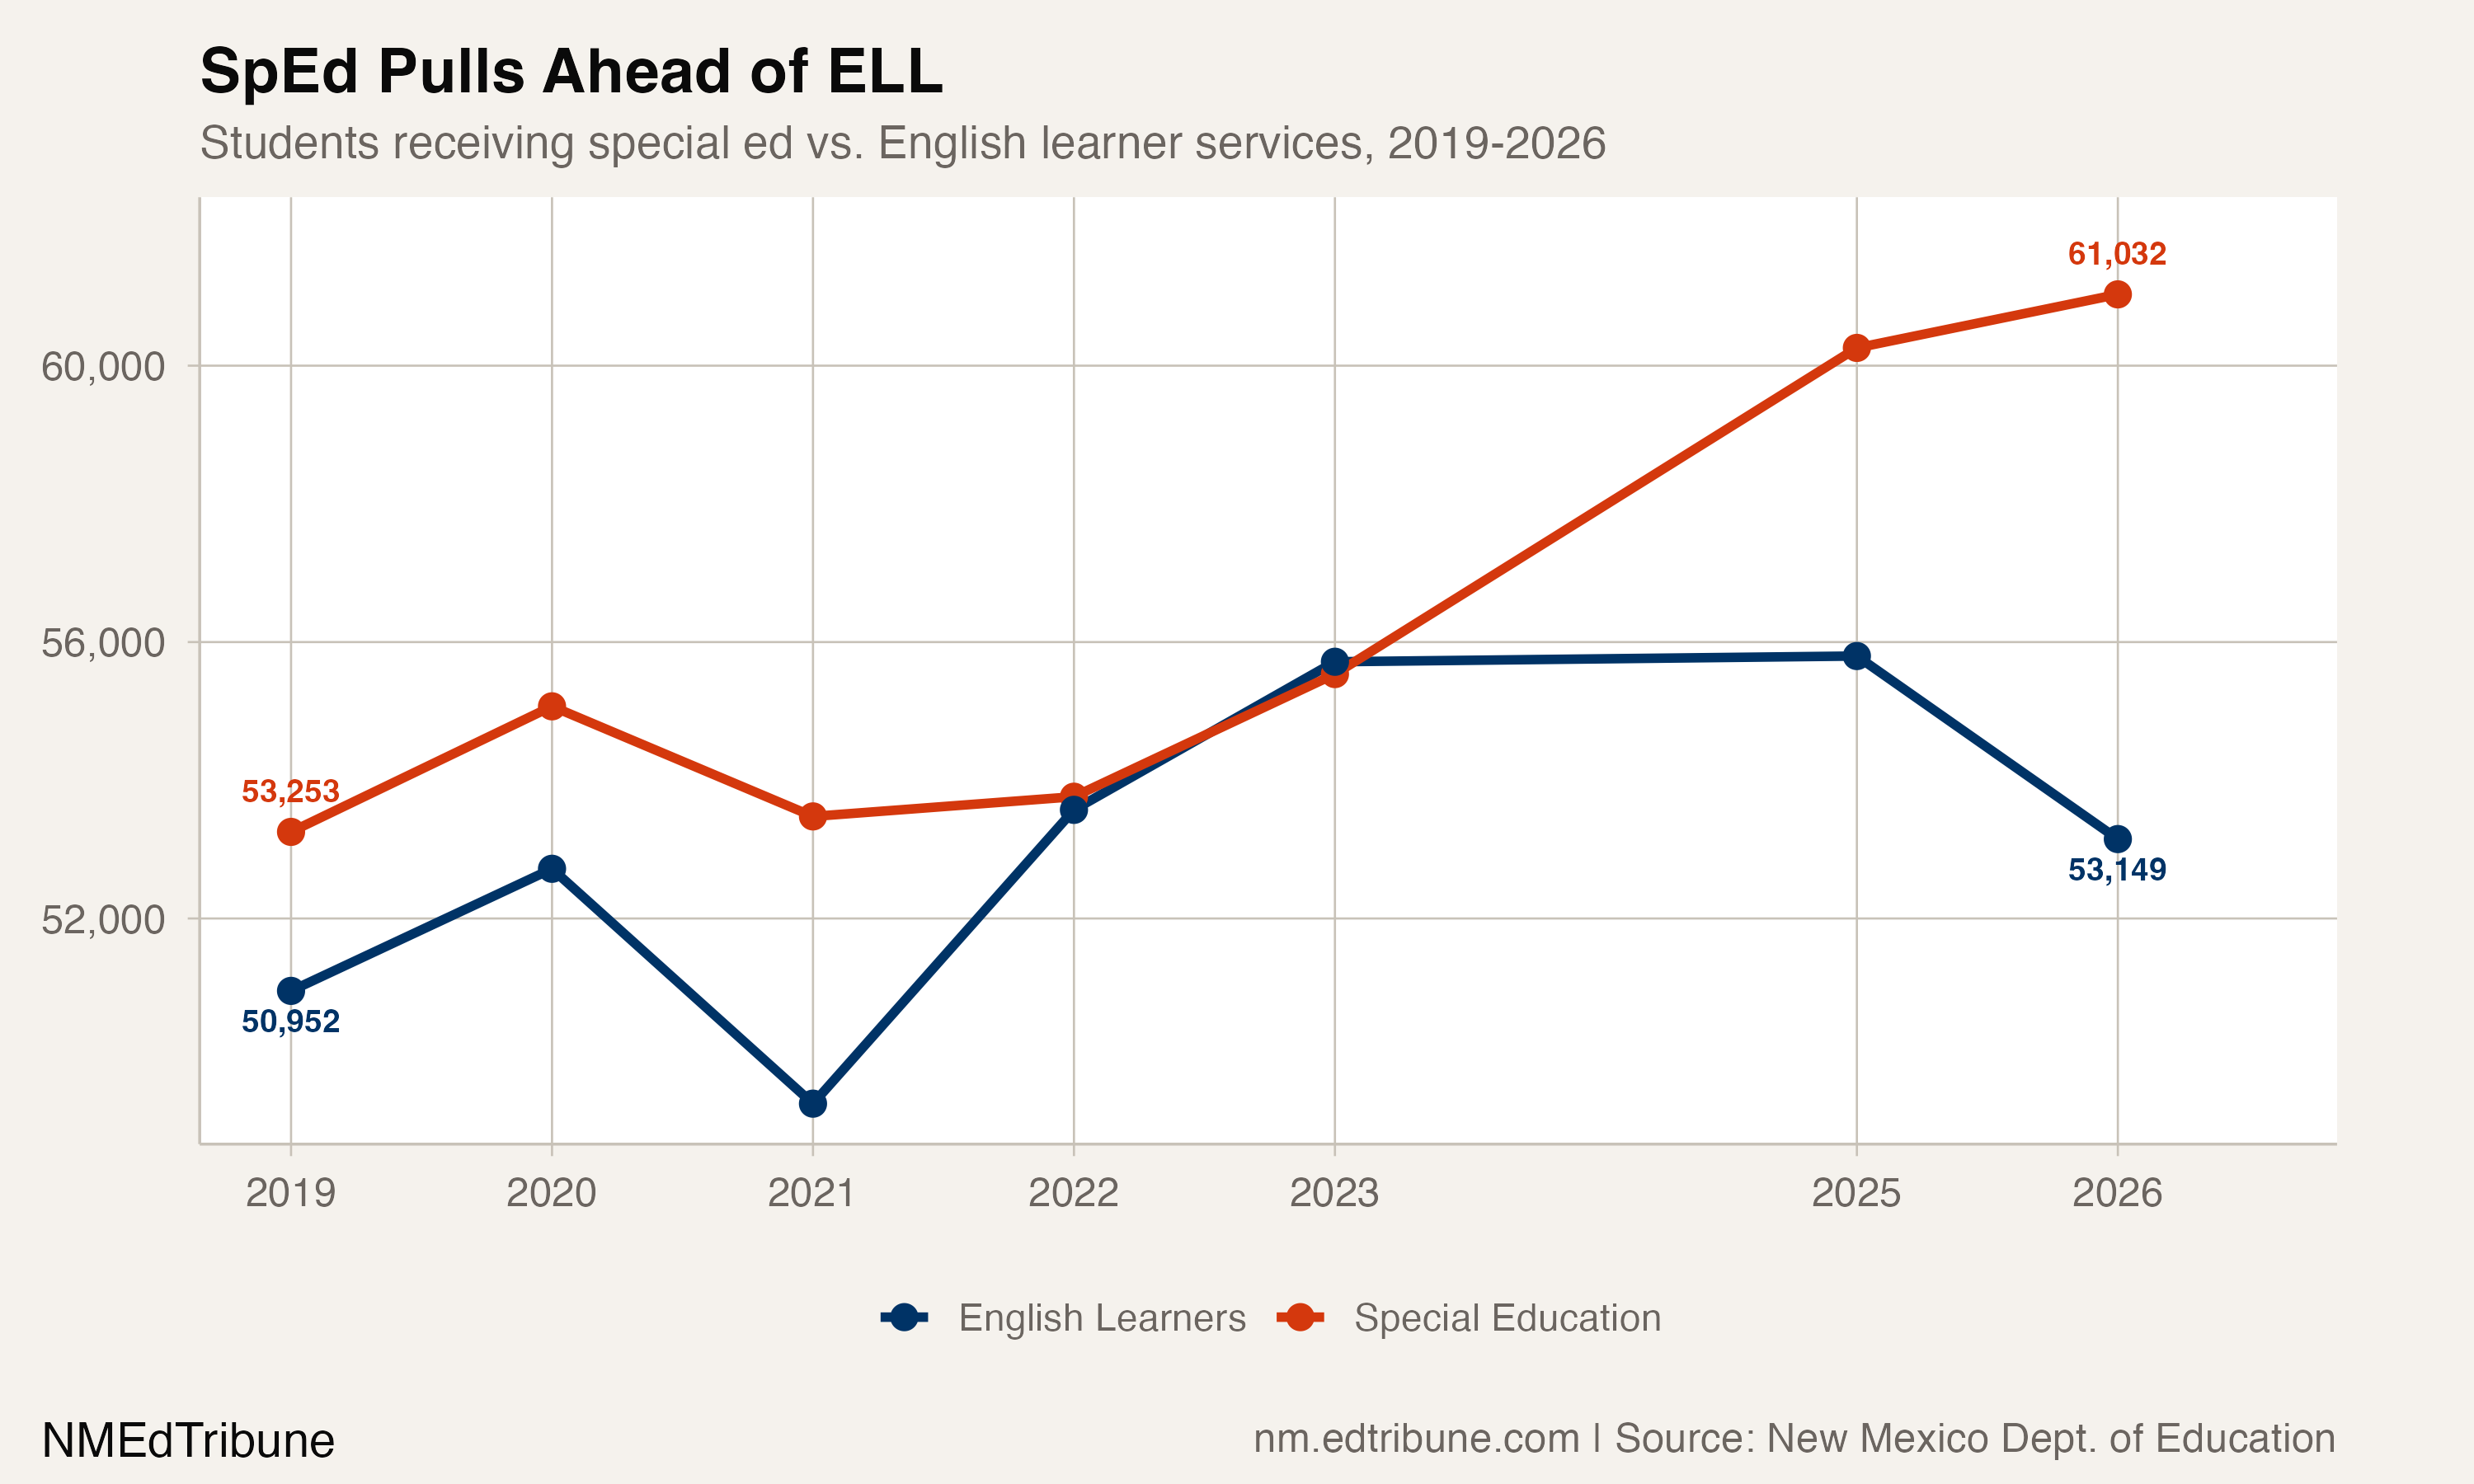
For most of the period, special education and English learner enrollment tracked closely. In 2022-23, ELL briefly exceeded special education by 178 students. By 2025-26, the gap reversed: special education now exceeds ELL by 7,883 students. The ELL count actually declined in 2025-26 (from 55,798 to 53,149), while special education continued growing.
These are overlapping populations, not separate ones. Many students receive both ELL and special education services. But the crossover marks a shift in where the state's service demands are concentrating. Special education, with its legal entitlements to individualized instruction, related services, and due-process protections under IDEA, carries a heavier per-student operational burden than most ELL programming.
Identification, not arrival
A 14.6% increase in the special education count while total enrollment falls 11% raises an obvious question: are more students arriving with disabilities, or are more existing students being identified?
The most likely explanation is expanded identification. Nationally, the rate of students receiving IDEA services rose from 14% to 15% between 2019-20 and 2022-23, a one percentage-point increase. New Mexico's 4.6 percentage-point increase over a similar period is far steeper, suggesting state-specific factors beyond the national trend.
Several forces could be driving identification upward. Post-pandemic catch-up evaluations are one: students whose initial evaluations were delayed during 2020-21 school closures and remote learning may have been identified in waves in subsequent years, creating a backlog effect. Improved screening tools and universal screening mandates adopted by some districts may also be catching students who would previously have gone unidentified.
The Yazzie/Martinez consolidated lawsuit, decided in 2018, may also be a factor. The ruling found that New Mexico was failing to provide a sufficient education to at-risk students, English learners, Native American students, and students with disabilities. While the ruling did not directly mandate higher identification rates, the increased scrutiny on services for students with disabilities and the state's subsequent investment in compliance infrastructure may have created institutional incentives to identify students who qualify for protections.
A competing explanation is that New Mexico's poverty rate and health-access limitations contribute to genuinely higher rates of developmental disabilities. The state consistently ranks near the bottom on child well-being measures. But this would not explain the acceleration: those conditions did not change dramatically between 2019 and 2026. The rate of change points toward identification practices more than population characteristics.
A workforce that cannot keep up
The staffing implications are severe. A 2023 study by New Mexico State University's Southwest Outreach Academic Research Evaluation and Policy Center found nearly 300 special education teaching positions vacant statewide. Separately, a Legislative Finance Committee report found approximately 1,300 teachers holding special education licenses were teaching general education courses instead.
"The most inexperienced people being placed in these most challenging positions." — Mary Parr-Sanchez, president, NEA-New Mexico, April 2025
The state attempted to address the shortage with a $5,000 retention stipend program for special education teachers, funded through House Bill 2. But in spring 2025, the Public Education Department pulled funding for the retention phase after the recruitment phase consumed most available resources. More than 700 teachers had been submitted for recruitment stipends before Albuquerque Public Schools had even submitted its list. The retention stipends never materialized.
The Legislative Finance Committee had proposed a $60 million allocation over four years for special education teacher pay differentials. The governor recommended $16 million as a one-time allocation. Neither figure was designed for a state where one in five students carries an IEP.
Charter schools carry less of the load
Traditional public schools serve special education students at a 20.6% rate. Charter schools serve them at 18.1%. That gap has narrowed from 2.1 percentage points in 2019 to 2.5 in 2026, but it still means traditional districts are absorbing a disproportionate share of the state's special education obligations relative to their enrollment.
This is a common pattern nationally. Charter schools often lack the specialized staffing, related-service providers, and facility infrastructure for high-needs IEPs, which can effectively steer families of students with significant disabilities toward traditional schools. The result compounds the fiscal pressure on traditional districts: they lose students (and the per-pupil funding attached to them) to charters while retaining a higher-cost student body.
No plateau in sight
The 20% threshold is not a policy trigger in New Mexico's funding formula. There is no automatic adjustment that kicks in when a fifth of a district's students have IEPs. But the rate is now high enough that it reshapes budget assumptions. Districts budgeting for 15% or 16% special education rates, as most were doing five years ago, are operating on outdated math.
National trends suggest the rate will keep climbing: improved awareness, expanded eligibility categories, and post-pandemic screening backlogs are all still in motion. If New Mexico's trajectory holds, the state could approach 22% to 23% within two to three years, joining Pennsylvania, New York, and Maine in territory where more than one in five students carries an IEP.
Meanwhile, nearly 300 special education teaching positions sit vacant statewide. The retention stipends never materialized. And the 61,032 students with IEPs are entitled, by federal law, to individualized services regardless of whether anyone shows up to provide them.
Detailed code that reproduces the analysis and figures in this article is available exclusively to EdTribune subscribers.
Discussion
Sign in to join the discussion.
Loading comments...